Each year, dozens of news articles (and more school projects, data stories, and research papers than we know about!) are written using data from the Mayor’s Management Report (MMR). This report has been published twice a year since the 1970s, and data since 2016 is available in an Open Data set and an interactive tool called the Dynamic Mayor’s Management Report. In this presentation, analysts who compile the MMR at the Mayor’s Office of Operations will show you the data behind the news stories. We’ll walk you through using public data to identify trends that are relevant to public interest, and how to find multiple data points related to the same theme so you can see the broader picture. This event is an introduction to a specific dataset and various uses, and is suitable for anyone with interest in this topic, regardless of technical skill. Anyone who is interested in creating narratives or data stories for school or public use, or who is interested in understanding how data makes it from City agencies to the pages of a newspaper, is welcome to attend.
Tag: Civic Engagement
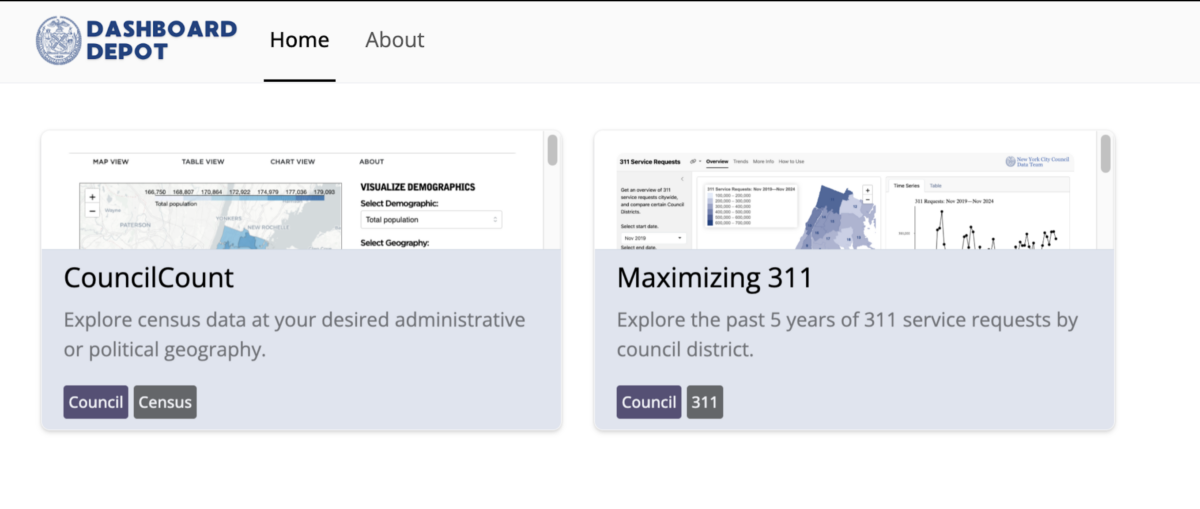
This session unveils two dashboards developed by the New York City Council Data team to transform large public datasets into accessible, actionable tools for the City Council. The CouncilCount and Max311 dashboards use data from the U.S. Census and NYC’s 311 Service Requests to offer insights tailored to the unique needs of each Council District.
Join us if you’re curious about creating dashboards for the public good, transforming large datasets into simple visuals, and delivering insights to decision-makers.
During this event, we will walk attendees through the dashboard development process. The CouncilCount dashboard provides demographic, socioeconomic, and other census data, curated specifically to help Council members better understand and serve their communities. Max311, on the other hand, leverages 311 Service Requests to track and analyze trends in community concerns, complaints, and issues reported by district.
The event will be a mix of presentation, live demo, and Q&A. We’ll start with an overview of the Council’s goals and challenges around public data, followed by a walkthrough of each dashboard. After demonstrating specific use cases, we’ll open the floor to questions and discussion on using open data for local government insights.