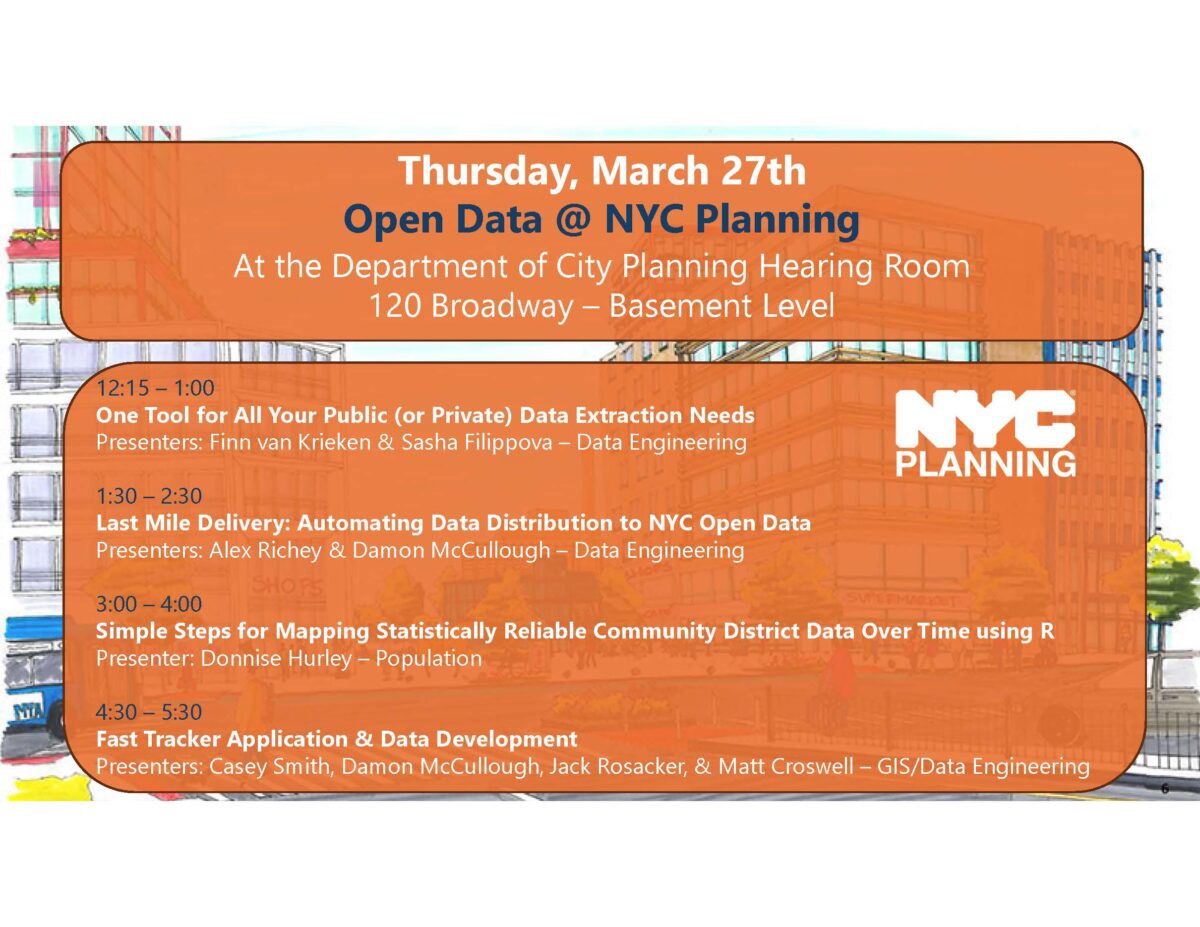
Comparing data from different census years can be a challenge due to changes in geographies. When those data are Public Use Microdata Sample (PUMS), it may be difficult to know where to start. In this presentation, Donnise Hurley from the NYC Department of City Planning will demonstrate step-by-step how to access PUMS data using the Census API, prepare data for analysis, harmonize older data into the 2020 PUMAs (approximate NYC’s Community Districts boundaries), and make an interactive map using a few lines of code. Attendees will gain a basic understanding of PUMS data, learn how to calculate margins of error and use them to create statistically reliable map categories, and learn data wrangling techniques.  All analyses will be conducted in R statistical software, but the techniques presented are transferrable to other programs.

This presentation is part of the Open Data @ NYC Planning event series.

Click here to RSVP for virtual attendance.

Click the blue “Going” button below to RSVP for in-person attendance at the Department of City Planning’s offices (120 Broadway, New York, NY 10271).

NYC School of Data is a community conference that demystifies the policies and practices around open data, technology, and service design. This year’s conference helps conclude NYC Open Data Week and features 30+ sessions organized by NYC’s civic technology, data, and design community! Our conversations and workshops will feed your mind and inspire you to improve your neighborhood.

To attend, you need to purchase tickets. The venue is accessible, and the content is all-ages friendly! If you have accessibility questions or needs, please email us at schoolofdata@beta.nyc.

Thank you to Reinvent Albany and Esri for helping to cover conference costs and making it possible to meet in 2025.

And If you can’t join us in person, tune into the main stage live stream provided by the Internet Society New York Chapter. Follow the conversation #nycsodata on Bluesky.

Purchase your tickets here.

This presentation will showcase the technical aspects of the Property Tax Forecasting included in New York City Council’s Economic and Tax Forecasting Report. The event will include an introduction to the revenue unit team, fundamentals of the property tax system, and the data collection and the forecasting model used. This report gets published by the New York City Council as part of the budgetary oversight three times a year.
The presenters are Dilara Dimnaku, Chief Economist at the New York City Council and Andrew Wilber, Supervising Economist at New York City Council Finance Division, Revenue Unit.
This event will be beneficial to other data science and analytics teams that are using similar data sources by providing use cases along with domain knowledge in housing and tax related administrative data. Participants will be able to ask questions at the end of the presentation.

The WeGovNYC Databook (https://databook.wegov.nyc/) is a data pipeline that indexes, normalizes, and republishes over 50 NYC Open Data datasets into a single interface that offers in-depth profiles of City agencies, public schools, civil service titles and more.

During this session, Devin Balkind of WeGovNYC will review how the Databook’s data pipeline works, give a tour of the interface, talk about some recent FOILing, share plans for integrating MTA data, and discuss their next-generation open data stack that will make it much easier for people to build data products using transformed data.

Join us as we share lessons learned from applying GenAI and Natural Language Processing (NLP) to alternative data sources! We’ll walk through a project where we used Public Pulse Mining to evaluate how the public engages with the General Services Administration’s construction projects and better understand local stakeholder priorities and perceptions.

Then, we’ll dive into an interactive prompt engineering exercise using our master prompt templates for structuring unstructured data. You’ll gain practical takeaways on using AI for public engagement, including how to extract insights from free-text datasets like NYC public meeting YouTube transcripts, 311 feedback, and consumer complaints.

This session is open to all audiences, regardless of technical background. We’ll also share open-source tools and scripts on GitHub so you can apply these methods to your own datasets!

In this virtual training, MTA’s Data & Analytics Team will walk participants through how to pull big datasets from the open data portal via the API using Python. Participants will briefly learn a bit about MTA’s Open Data Program before being invited to follow along while the team demos how to pull MTA’s larger datasets off of the Socrata platform. While the data is pulling, the team will show some interesting analysis you’ll be able to do, centered around the Congestion Relief Zone!

Urban street flooding presents significant challenges for metropolitan areas like New York City, particularly in the face of intense rain events. In this workshop, we will explore the causes and variability of streetflooding using NYC Open Data and machine learning techniques. Building on prior research, we aim to reproduce findings on flood risk factors while incorporating updated data from NYC 311 service requests data and other sources such as the U.S. Census. This approach will enhance our understanding of how socio-economic and infrastructural factors contribute to flooding, offering new insights into the spatial dynamics of flood risk.

The workshop will focus on three key topics: data cleaning to process NYC 311 flood reports and supplementary datasets, exploratory data analysis to identify patterns in flood risk factors, and predictive modeling using Random Forest regression. By analyzing how factors like land features, topography, and population dynamics influence flood risk, participants will gain hands-on experience with urban flood modeling techniques.

Four students from the Spring 2025 Introduction to Data Science course at UConn will present their projects in sequential order, each focusing on one aspect of the core topics. The presentations will be followed by a Q&A session, providing participants with an opportunity to engage with the presenters and explore the findings in greater depth.

  • How confidently can we predict the impacts of zoning change on housing supply?
  • Can we use AI to create novel datasets that may allow us to better understand housing phenomena?
  • What would it take to model a reality in which we build 1 million housing units?

These were some of the questions that led Janita Chalam, an independent researcher with a background in software engineering and machine learning, to begin their research journey into discovering how open data, statistical modeling, and AI can help us tackle the housing affordability crisis.

This presentation will walk through what Janita has learned about the variables at play in NYC’s housing landscape and present a statistical analysis of the Bloomberg-era upzonings as a case study in examining the frictions to building more housing in NYC.

Finally, Janita will propose some ideas for what kind of data and methodologies we might need in order to make bolder claims about what it takes to get us out of the housing crisis. By the end of this talk, we will hopefully have a better understanding of the role that data and empiricism can and should play in our conversations about housing policy.

This talk is for anyone interested in housing affordability and will not require any expertise in the technologies mentioned.

Anyone who uses data to make decisions must possess certain critical thinking skills that go beyond mere technical craft. But, what are these skills exactly? Join CUNY professor Eldar Sarajlic in a lecture about Critical Data Literacy, a philosophical approach to reasoning with data. You will learn about the conceptual background of thinking with data and have the opportunity to test your data-reasoning skills.

This talk is for anyone who plans to access open data and make any kind of arguments or claims based on the data. The hope is that you will walk away with a stronger toolkit to think about what a dataset means and does not and be better equipped to avoid fallacies of inference.

Join us in celebrating NYC Open Data Week by playing with squirrel data! 🐿️ Presented by Kiley Matschke (Post-Baccalaureate Fellow, Barnard College Vagelos Computational Science Center), this workshop will explore the intersection of data visualization and gameplay using real Squirrel Census data. 📊 Participants will learn how to use the game engine LÖVE to work creatively with data through the lens of game design principles. 👾🎮 This workshop is open to people from all backgrounds and coding levels! Beginner friendly. This event is being held hybrid online and in-person at Barnard College. Due to security measures at Barnard College requiring Barnard/Columbia IDs to enter campus, we ask that those who are not affiliated to please attend via Zoom!

RSVP for virtual or in-person attendance https://lu.ma/uhz6hdu5