Sandwiches are my passion. When the New York Times unveiled its list of 57 sandwiches that define New York City, I wanted to try them all. The problem: the NYT list only provides sandwich names and restaurant addresses. Determining if I’m near an iconic sandwich requires scrolling, reading, and flipping between the list and Google Maps. The solution: I need a sandwich map!

In this workshop, rather than just traditional coding, we’ll use a large language model (LLM) as a pair programming partner to help us tackle challenges, offer suggestions, and streamline the development process. By the end, you’ll know how to combine basic Python coding with web scraping, Google Maps, and GitHub Pages.

Join Randall’s Island Park Alliance and New York Sea Grant for a discussion on data sharing in the environmental field. Olivia Smith, Park-as-Lab Coordinator, will present on ongoing environmental monitoring projects on Randall’s Island, focusing on waterfront stewardship. The Park-as-lab website will be used as a model for sharing long-term datasets. Catherine Prunella, Water Quality Extension Specialist, will highlight community datasets on flooding and marine debris through the New York Sea Grant interactive dashboard. The event emphasizes the importance of community engagement in collecting environmental data and fostering collaboration among community members, non-profits, and academics.

After the discussion, join a brief guided tour of the Little Hell Gate Salt Marsh to see a restored ecosystem and participate in a microplastic sampling demo. All those interested in environmental science, community data collection, and ecological restoration are welcome!

Part II of a presentation on data quality presented by David Tussey, formerly of the NYC Department of Information Technology and Telecommunications and Jun Yan, professor of statistics from the University of Connecticut. Part I focused on how to undertake a data cleansing effort.

This presentation focuses on measuring data quality over time. In this presentation we will examine the challenges of measuring data quality over time; essentially attempting to answer the question “Is my data getting better or worse?”. We discuss some data quality measures, how to capture and visualize these over time, and how to detect deviations in data quality using a process known as statistical process control. We will demonstrate the framework we propose with real-time demonstration of data quality scripts executed against the 311 SR dataset.
At the end, we hope to illustrate both issues and a potential solution for measuring the changes in data quality over time.

This is a virtual presentation illustrating how to undertake a data cleansing effort It is Part I of a two part presentation involving data quality presented by David Tussey, formerly of the NYC Department of Information Technology and Telecommunications and Jun Yan, professor of statistics from the University of Connecticut.

This part will describe the steps of a data cleansing effort, and illustrate those steps via live, real-world examples utilizing data from the NYC 311 Service Request dataset. We will examine the 311 SR dataset for anomalies. It is intended to be an instructional session reflecting lessons learned from our previous data cleansing efforts, augmented by real-time code execution providing examples of each step. By the end, we hope attendees will have a basic understanding of how to go about “cleansing” their own data sets.

Part II, presented on Thursday, 3/27 will deal with evaluating data quality over time in an attempt to answer the question “is the data getting better”?

A hour-long virtual seminar where master or Ph.D. students in Biostatistics at the NYU School of Global Public Health (GPH) will present ongoing research into New York City. The speakers’ list and title of their talks are (with a brief description for each):
– NATHANIEL MAXEY (A QUASI-EXPERIMENTAL STUDY OF NEW YORK CITY’S SODIUM WARNING REGULATION AND HYPERTENSION PREVALENCE, 2005-2020):
– In 2015, New York City required chain restaurants to label high-sodium menu items to raise awareness of health risks like high blood pressure and heart disease. This study analyzed community health data from 2005 to 2020 to assess whether hypertension rates changed after the regulation took effect in 2017.
– ZHIYUAN NING (RELATIONSHIP BETWEEN CYCLING AND THE PREVALENCE OF HYPERTENSION AMONG ADULTS IN NEW YORK CITY):
– Hypertension affects nearly half of U.S. adults, but regular physical activity, like cycling, may help manage blood pressure. This study analyzed New York City health data and found that people who cycle more frequently are less likely to have hypertension, highlighting cycling as a potential non-medication approach for blood pressure control and public health policy. (Data: NEW YORK CITY COMMUNITY HEALTH SURVEY)
– ANNIE QIU (ANALYZING POTENTIAL DIFFERENCES FROM INPATIENT AND OUTPATIENT SATISFACTION AMONG SEXUAL ORIENTATION AND GENDER MINORITY (SGM) ONCOLOGY PATIENTS BETWEEN 2021-2023 IN A LARGE SINGLE-CENTER, RESEARCH-ORIENTED, URBAN CANCER CENTER OF THE UNITED STATES NORTHEAST):
– This study aims to assess the experiences of sexual orientation and gender minority (SGM) oncology patients using HCAHPS and Press Ganey surveys to evaluate inpatient and outpatient care quality. By analyzing survey responses from 2021 to 2023 at a major urban cancer center, the study will use factor analysis, POMP scoring, and multiple regression to identify predictors of patient satisfaction, ultimately informing institutional improvements and addressing disparities in SGM patient care. (Data: HCAHPS questionnaire)
– ANGEL SINGH (TIMING OF NONCARDIAC SURGERY AND PERIOPERATIVE MAJOR ADVERSE EVENTS AFTER CARDIOVASCULAR INTERVENTIONS):
– Patients with heart disease face significant risks when undergoing noncardiac surgery, especially after recent heart procedures like stent placement or valve repair. This study examines the safest time to schedule surgery after these interventions and evaluates the risk of major heart complications at different time intervals, helping improve surgical guidelines and patient outcomes.
– ADEEBA TAK (ENERGY USAGE, ENERGY EFFICIENCY & GREENHOUSE GAS EMISSIONS IN NEW YORK CITY BUILDINGS)
– New York City’s buildings account for nearly two-thirds of its greenhouse gas emissions, contributing to air pollution and climate-related risks. Using machine learning models, this study analyzes energy usage and forecasts emissions in new constructions, highlighting the urgent need for stronger sustainability measures and improved energy policies.

Join our virtual event to discover a cutting-edge tool that pinpoints prime tree planting sites across NYC using NYC Open Data. This model empowers NYC Parks foresters to expand the City’s green canopy more efficiently. The model leverages datasets such as NYC Parks Tree & Site, NYC Planimetrics, DOT Traffic Signs, and the DOH Heat Vulnerability Index to drive site selection. Shawn Ganz, Data & Product Designer with NYC Parks, will break down the model’s purpose, methodology, and data foundations while advocating for greater open data access in urban planning. Wrap up the session with an engaging Q&A and discussion on future applications.

CUNY Tech Prep fellows will demo three projects from their fellowship year:

  • Team Slice Scout (Matthew, Jack, Rei, and Tor) will share their full-stack web application that tracks and categorizes NYC pizza prices, utilizing React, TypeScript, Express.js, and PostgreSQL.
  • Team Subway Surfers (Arihant, Md, and Zara) will share their data science dashboard that visualizes station-specific crime trends across NYC using Python and Streamlit.
  • Additional fellows from across Tech Prep’s Web Development and Data Science tracks will present their insights from a new “Mastering Spreadsheets” lecture that uses Open Data APIs to bring data into Google Sheets.

Moderators and project mentors: Lead Instructor, Dr. Edgardo Molina | Data Science Instructor, Zack DeSario

Open to all who want to 1) meet CUNY entry-level talent and/or 2) learn more about how to use NYC Open Data resources in education and workforce development to help undergraduates land roles in technology.

Learn more about CUNY Tech Prep on our website! cunytechprep.org

Join Data Dissemination Specialist Joli Golden to explore easy to use tools like QuickFacts and Census Narrative Profiles to find free local data to leverage in your grant proposals. See how to access the most current and relevant demographic statistics from the American Community Survey and the 2020 Census in data.census.gov. Take a look at how using different levels of geography in your searches and easy to create thematic maps can help you to build a more compelling case for grants. This training is recommended for all data users.

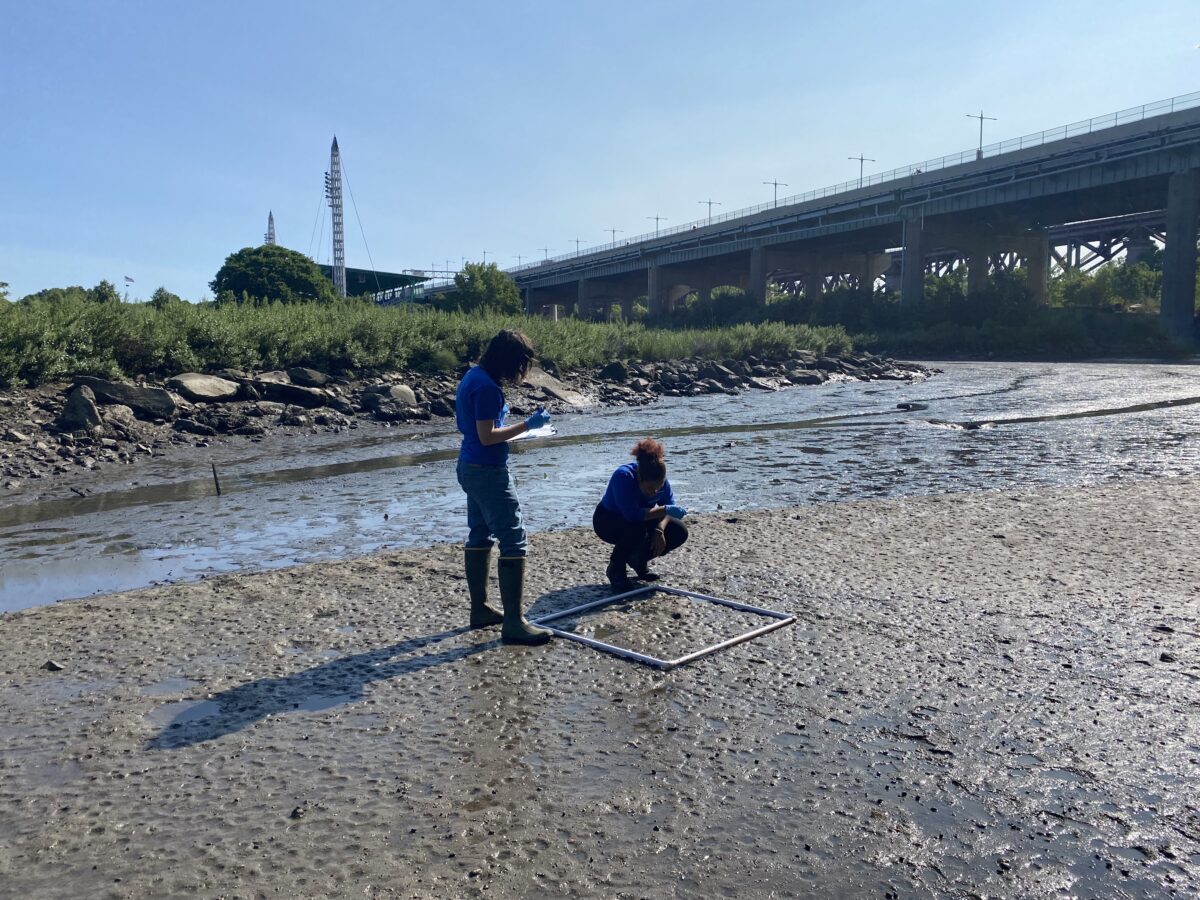
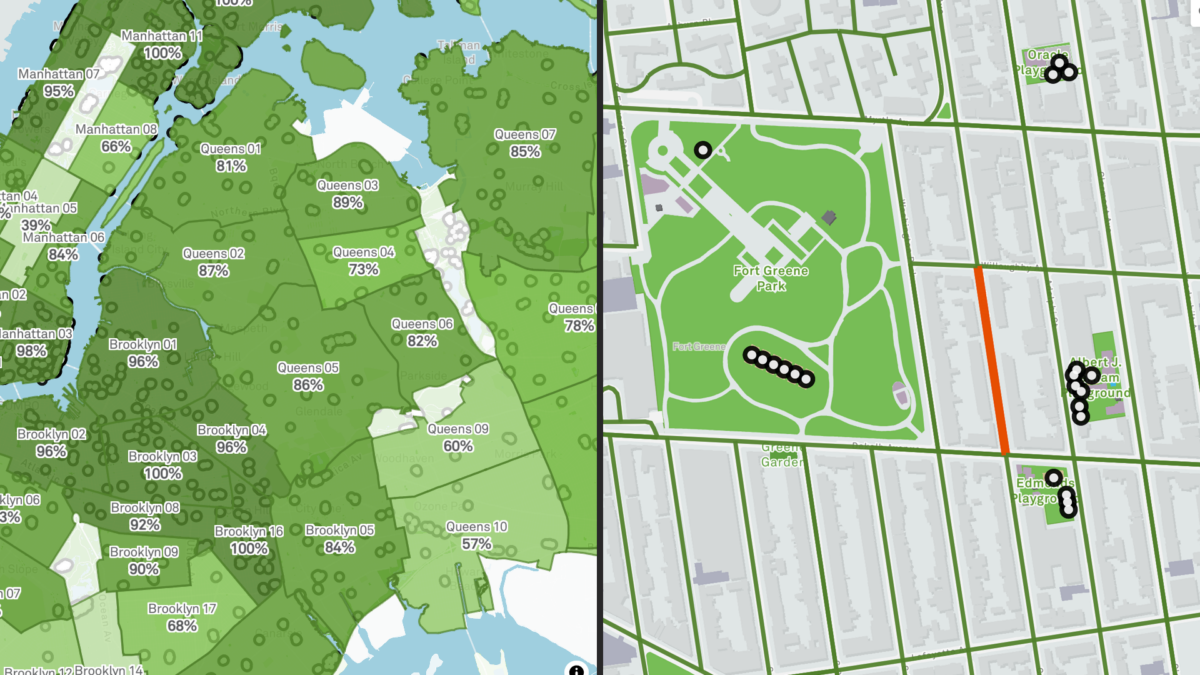
Have you ever wondered how parks in your neighborhood compare with others? Meet the Vital Parks Explorer! In this session, the Innovation & Performance Management (IPM) team from NYC Parks will share some highlights of how this public-facing tool was built. The Explorer visualizes access to parks amenities and services across the city. From inception and prototype, to public release, three data professionals working in local government will give you a behind-the-scenes look at how data, analysis, visualization, and user experience considerations shaped the final product. This event is for all New Yorkers who care about parks and might be of particular interest to advocates of public spaces, civic data enthusiasts, web app developers, designers, geospatial data scientists and engineers. We look forward to your participation and feedback!

Speaker bios:
Lilian Chin is a Data Analytics Specialist on Parks’ IPM team, where she has worked since September 2023. As part of IPM, she supports a wide-range of data-driven initiatives for Parks’ Maintenance and Operations. This includes visualizing the Work Order backlog, streamlining data pipelines for park assets, developing methodologies for the Park Condition Score, building in-house dashboards, and improving data quality and documentation.

Kate Sales is a Data Analytics Specialist on Parks’ IPM team. In the last year, she has worked on projects that touch many aspects of Parks including collecting and combining volunteer data for the Let’s Green NYC initiative, creating dashboards for Vital Parks for All, and helping others learn how to visualize data. Before Parks, Kate was a GIS analyst at the urban planning consulting firm Urban3 in Asheville, NC, her hometown. She recently completed her Master of Urban Planning at CUNY Hunter College and earned her BA in geography at Macalester College.

Benno Mirabelli is a Data Scientist on Parks’ IPM team. He works on various data analysis, reporting, research, and optimization projects. Some examples of his ongoing work include the routing analysis based on LION data for the recently released Vital Parks Explorer, research on understanding usership patterns and visitor volume at parks, and new management tools that assist with grass maintenance, planning, seasonal worker assignments and more. He holds a PhD in Applied and Computational Mathematics.