Ditch the spreadsheets for 60 rebellious minutes—this session blends a 20-minute crash course on hijacking data for public art with a 40-minute hands-on activity. Armed with markers and mischief, we’ll break into pairs to craft provocative data posters and crowdsource live responses from the crowd. By the end, you’ll leave with street tactics to turn cold numbers into heated conversations.

Hosted by The Data Vandals (Jen Ray & Jason Forrest)
https://datavandals.com/

Come by BRIC before this workshop to see the Data Through Design artwork and sit in on a panel with the 2025 artists.

Agenda for the event:
*After a short presentation (20 minutes) covering our foundational Data Vandals ideas and recent projects, we’ll invite the audience to join us in a hands-on mini-workshop (40min).

*The Data Vandals will provide a topic and the participants will then break into pairs.

*We will provide paper and markers to the participants and will help attendees formulate questions in order to collect data from the larger group.

*After 20min each pair will share their poster and everyone will vote with stickers to indicate their responses to the questions.

*Once the “data” is collected (10min), we can discuss!!

Data Through Design (DxD) is an independent, volunteer-run collective which organizes an annual art exhibition that creatively analyze, interpret and interrogate data made available on NYC Open Data. Each year a theme is developed to challenge artists to surface hidden stories, patterns, and connections in data; to examine its shortcomings; and to question claims to objectivity that data representations may project. These novel and artistic creations harness the potential for data to enliven and deepen our understanding of life in the city.

Please join Data Through Design for a panel discussion with participating artists from the Corpus: Bodies of Data exhibition on Sunday, March 30th at BRIC from 2:00 – 4:00 pm. RSVP here

And stick around after the panel for a hands-on workshop with the Data Vandals!

2025 Artists and Projects
Elias Bennett, Simon Lesina-Debiasi: Final Inch: Mustard, Data, Sauerkraut
Mauricio Delfin: The Timelines Project
HK Dunston, Jill Sigman, Abigail Regner, Mariya Chekmarova: Breath Atlas
Michelle Hui: Aging Out of Place: Chinatown Elderly
Alison Long, Cass Yao, Keyarow Mosley: Body of Waste
Matías Piña, Arden Schager: Hyperphagia
Natch Quinn: The Entirety of NYC Land
Nishra Ranpura: Tapestreet: The Fabric of NYC
Aida Razavilar, Paul Hanna: Tower of Babel: Bodies of Language in Lexicon
Jessica Reisch: Marsh Temporalities

Open Data is rich, but can be overwhelming. Creating succinct, focused measures from Open Data allows New Yorkers quickly see how things are going and better understand complex issues.

The NYC Comptroller’s office recently released two new data dashboards that use Open Data resources to (1) track NYC Agency performance (https://comptroller.nyc.gov/services/for-the-public/measuring-nyc-government-performance/overview/) and (2) chart homelessness and eviction challenges facing New Yorkers (https://comptroller.nyc.gov/services/for-the-public/charting-homelessness-in-nyc/overview/).

This in-depth demonstration will:

  • Detail the information available on these two dashboards:
  • Measures of how key City agencies are delivering for New Yorkers
  • Details on the populations experiencing homelessness, facing eviction, and actions by the City to prevent eviction and move individuals out of shelter into permanent housing.
  • Show how we endeavored to tell full, meaningful stories of how City agencies are doing and the challenges New Yorkers face, relying only on public Open Data.
  • How to create relevant, informative measures from raw source data
  • How to combine and overlay data sources to add depth to a complex topic like housing and homelessness
  • Facing limitations of the data available
  • Give an overview of the technical tools to build dashboard views on Open Data sources
  • Querying Open Data data and metadata
  • Connecting data to PowerBI and custom tools

This session is a chance for researchers and Open Data users to get an in-depth understanding of the data available on these new dashboard products, learn how to design rich dashboards that contribute to understanding on complex policy issues, and get technical pointers for accessing Open Data.

The NYC TLC Factbook is a public-facing PowerBI dashboard that showcases charts, maps, and key metrics on various data and policies, including trip counts, electric vehicles, driver pay, utilization rates, and driver demographics. The underlying data for the dashboard includes publicly available information, such as trip data, as well as more sensitive data that is kept confidential to protect driver privacy. The Data Analytics team, part of TLC’s Policy Division, invites members of the public to an interactive presentation that offers an in-depth look at the analysis behind the dashboard, as well as how it helps evaluate and monitor critical policies

Queens Public Library staff will share how we use and visualize publicly available data to glean insights about the communities we serve and to inform our programs and library services.

We will provide an overview of how maps could be created using ArcGIS Online, NYC Open Data, and a NYC Planning shapefile. We will finish up by sharing free resources for further learning.

This is a session for anyone interested in making data-informed decision-making accessible to all.

Presenters: Kyeesha Wilcox, Josephine Lew, Jin Hyun Bae

In this presentation, we will introduce our recently developed urban heat portal for NYC. We will demonstrate how each layer in the heat portal is prepared. We used a variety of resources to prepare urban heat layers. They include:

  • Satellite data from Landsat 8 and 9
  • Weather Station Data from Visual Crossing
  • A variety of layers from City’s open data including Land Cover (Tree cover and permeable surface cover), NTA, Parks, buildings.

In this presentation, you will learn about the science of urban heat and the methods used for producing multiple layers that are publicly available for download. We will explain the workflow and the models that are developed to create Mean Radiant Temperature, Air Temperature, Heat Index, and an overall Outdoor Heat Exposure index.

This event will be hybrid.

For in-person attendance at Hunter College, please RSVP in advance using the “Going” button below, as front desk security will need a list of attendees in advance. Please arrive 15 minutes in advance to get a pass.

For virtual attendance, please RSVP using this link.

OpenStreetMap is the world’s largest volunteer-driven spatial dataset, relied on by millions of people around the world. But it’s more than one big map! Need to keep track of every playground, defibrillator, storm drain, or LGBT-friendly bar in your neighborhood? OpenStreetMap lets you leverage the power of crowdsourcing to fill data gaps left by commercial and government datasets. You can manage your data all in one place for the benefit of the entire OSM community.

Join OSM expert Quincy Morgan and civic innovation specialist Jazzy Smith to learn how organizations can use OSM as a free, collaborative GIS platform to meet their geodata needs. We’ll cover OSM basics, introduce available resources and workflows, review case studies of groups leaning into OSM, and look at how the Mapping for Equity project is connecting New Yorkers to their data.

This talk is for those of all skill levels interested in open map data. Come with questions! We’ll leave plenty of time for discussion.

Have you ever tried working with the 311 dataset available on Open Data? Notice how it’s very, very big? Join us for our presentation, where we demonstrate how we use this dataset. Nisuka Williams, a recent graduate of Columbia University, will share how to create a webmap using Open Data APIs. Using HTML, CSS, and JavaScript, this presentation will demonstrate ways to filter the data in the front end to display the data. No prerequisites are required to attend, though knowledge of front-end coding is a plus. If you’d like to try this yourself, all the code is available on GitHub.

Join this interactive demonstration of DataKind’s Economic Opportunity Datascape (EO Datascape), a platform dedicated to enhancing financial well-being and economic opportunity through the power of data.

Leveraging nearly 10 public data sources, this session will showcase how the EO Datascape can help stakeholders, from Community Development Financial Institutions to nonprofits and policymakers, access comprehensive, geographically standardized, financial and economic data to make informed decisions and offer tailored services to better serve communities. The EO Datascape provides users with the ability to customize their experience by selecting key economic and financial indicators across diverse themes and public datasets—including socio-economic indicators, small business metrics, banking and investment data, and housing data—enabling them to preview and download a tailored dataset at the 2020 U.S Census tract boundaries.

During this event you’ll explore how this tool can support data-driven decision-making and unlock new avenues for inclusive economic opportunity across New York City.

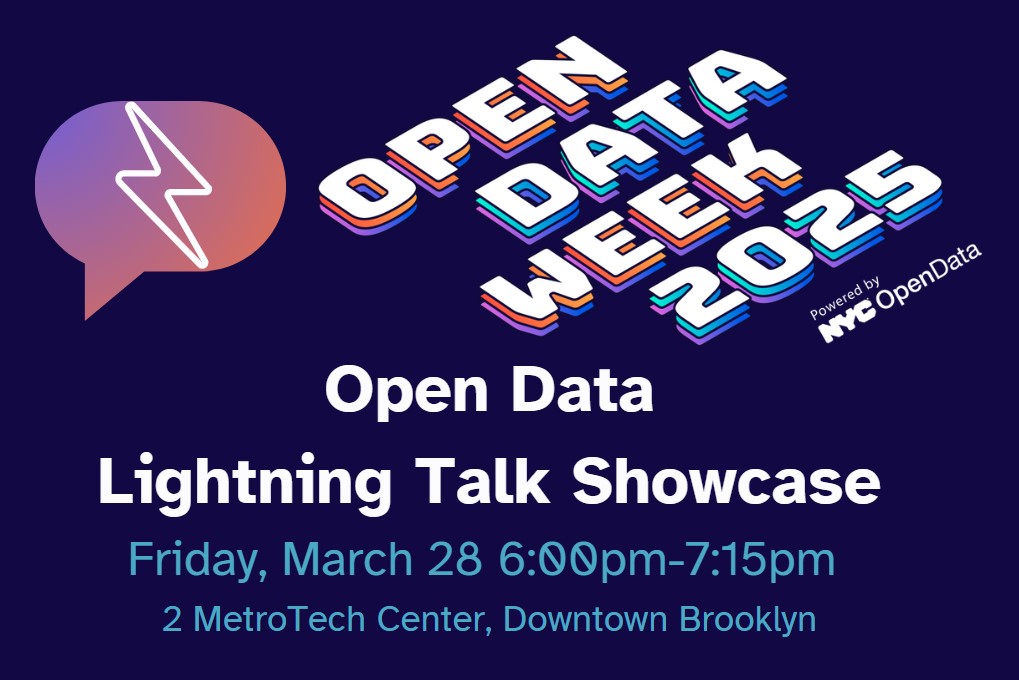
Come to the NYC Office of Technology & Innovation offices on Friday, March 28 at 6PM for a lightning talk showcase, featuring open data use cases about the human brain, the environment, web domains, trash cans, and film locations. Each of the presenters will have a few minutes to showcase their work, and this will be followed by an audience question-and-answer period.

The presentations:

Arianna Zuanazzi – Exploring Child and Adolescent Mental Health in NYC: Insights from the Healthy Brain Network Open Dataset
The Healthy Brain Network (HBN) is a large-scale open science initiative of the Child Mind Institute which releases multimodal datasets capturing a broad range of clinical psychopathology in children and adolescents based in NYC. For this event, we will briefly introduce the openly available phenotypic and neuroimaging HBN datasets and present data and visualizations that illustrate socio-economic status, neighborhood crime and safety, school risk, and mental health in NYC children and adolescents. We will then explore how the HBN dataset can be combined with datasets from NYC Open Data, such as air quality and pollution data.

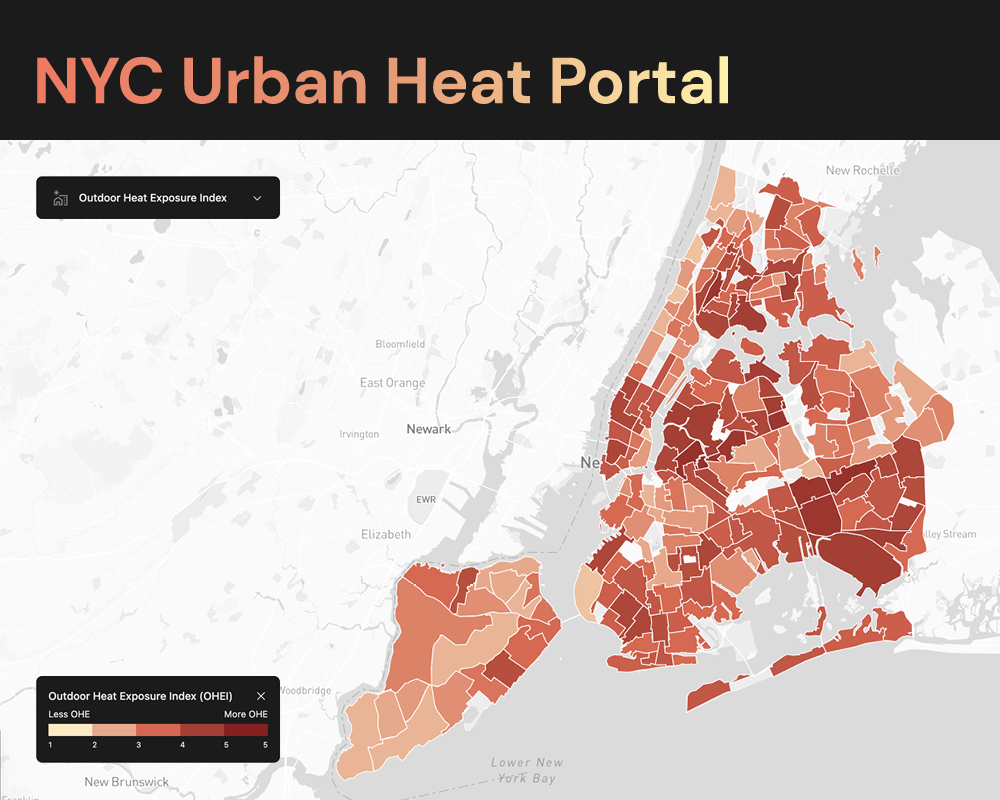
Surbhi Agrawal – Using Open Data to Map Regional Resiliency Risk and Assets
Sasaki Associates has developed a data platform to empower communities in mapping and understanding regional risks from natural hazards and stressors, alongside identifying critical community assets. Using open datasets, this platform visualizes data such as expected losses to populations, infrastructure, and agriculture, enabling informed decision-making for resilience planning.

Frank Noirot – Mapping the trash can landscape in NYC with QGIS and Open Data
I wondered how far people had to walk to the nearest litter basket anywhere in NYC, and thanks to NYC Open Data I was able to make a map that does just that, even though I’m no data scientist! I wrote about my process in making the map. I want to encourage others who have questions about the environment they live in to take a search through NYC Open Data to see if there is a data set that fits their topic. They might be pleasantly surprised with what they find.

Bailey Kane – Enriching NYC Open Data for .nyc Websites
All .nyc domain registrations since the beginning of the program are logged in a NYC Open Data dataset. However, actual use of those registered domains is not tracked. I was curious how people are using .nyc domains, so I started AllOf.nyc to explore all registered .nyc websites by expanding upon the data offered in the NYC Open Data dataset.

Cory D. Reeves – Simulating Soundscapes: NYC Open Data for Amplified On-Site Film Location Selection
Filming in New York City presents unique challenges—permitting, logistics, and environmental sound control measures during production are some examples. Our award-winning prototype from Autodesk University 2024’s Design & Make Conference, Dynamo Day Hackathon leverages NYC Mayor’s Office of Media and Entertainment (MOME) structured film permit datasets within Autodesk Forma’s AI-powered noise analysis engine, creating real-time feasibility assessments to support film location selection. This solution enables production teams to evaluate potential filming sites more in-depth, and to-scale within dynamic, virtual 3D space before more costly on-location mobilization of film crews and production staff.

Make a night of it! Before the event, consider checking out the Data Through Design exhibition at BRIC (647 Fulton St, Brooklyn), which is a 10-15 minute walk from this event. Afterwards, join us for a happy hour a few blocks away at Sound & Fury Brewery and Kitchen (141 Lawrence St, Brooklyn).