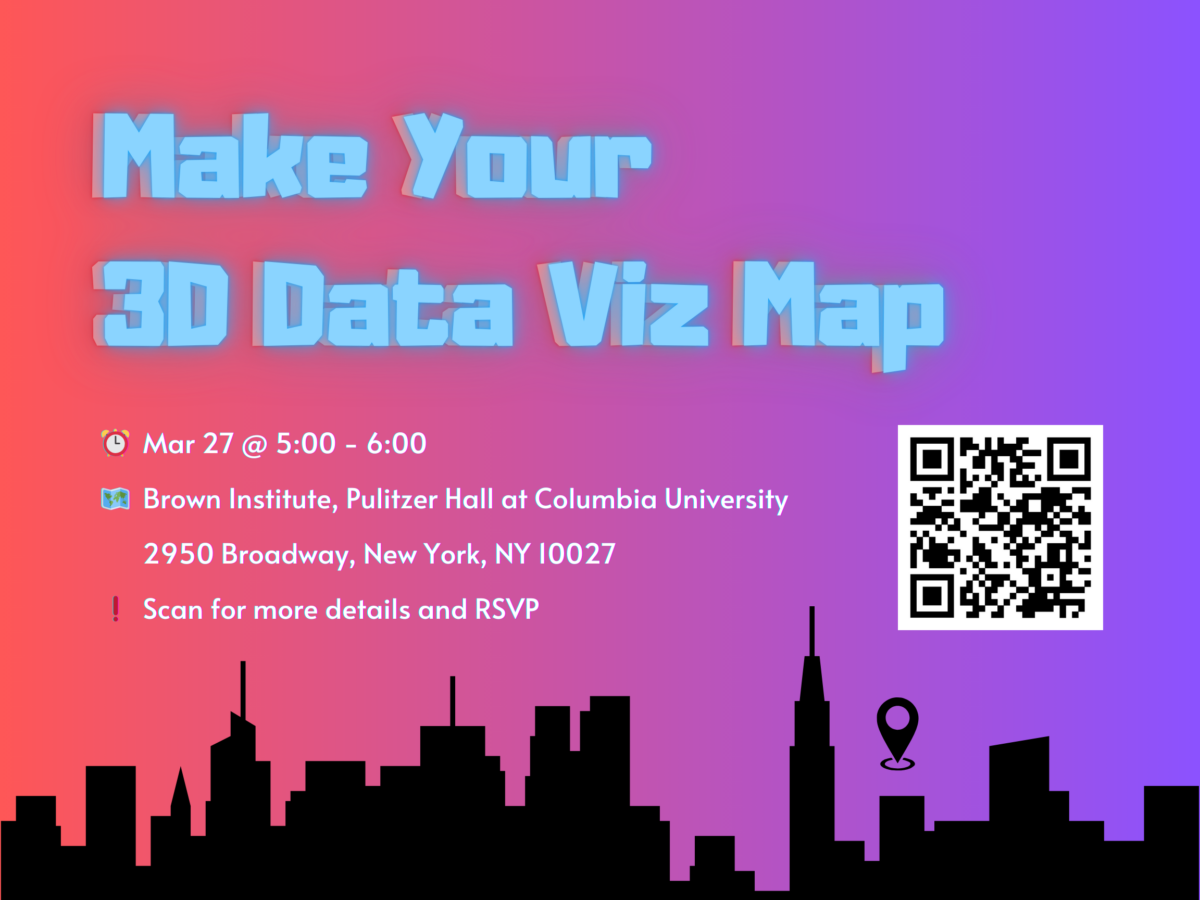
As media today is shifting to web-based and digital-first, there is huge potential for higher dimensional data visualization to play its role in innovative storytelling. In this session, we’ll discuss advantages of 3D visualizations and learn from real-world use cases, including a 3D map of Scaffolding in NYC. We’ll also gain hands-on experience by walking through the procedure to create a 3D geospatial data visualization with PyDeck, a layer-structured python library. Learn to quickly develop and prototype exploratory visualizations and see your data from new perspectives. This session is moderated by Yanan Sun, Local News Researcher at UNC-Chapel Hill, and co-hosted by Tow Center for Digital Journalism at Columbia Journalism School.

SOLD OUT

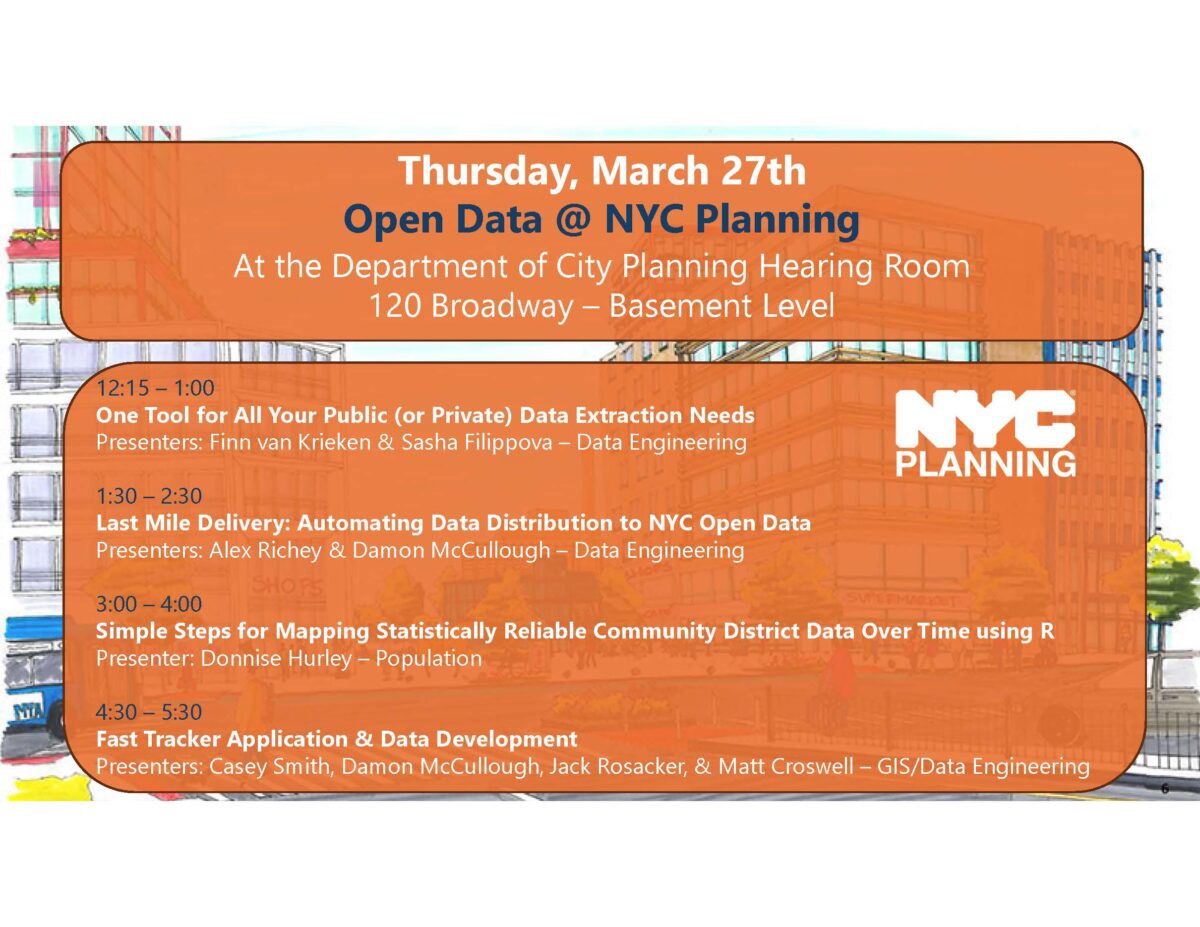
Comparing data from different census years can be a challenge due to changes in geographies. When those data are Public Use Microdata Sample (PUMS), it may be difficult to know where to start. In this presentation, Donnise Hurley from the NYC Department of City Planning will demonstrate step-by-step how to access PUMS data using the Census API, prepare data for analysis, harmonize older data into the 2020 PUMAs (approximate NYC’s Community Districts boundaries), and make an interactive map using a few lines of code. Attendees will gain a basic understanding of PUMS data, learn how to calculate margins of error and use them to create statistically reliable map categories, and learn data wrangling techniques.  All analyses will be conducted in R statistical software, but the techniques presented are transferrable to other programs.

This presentation is part of the Open Data @ NYC Planning event series.

Click here to RSVP for virtual attendance.

Click the blue “Going” button below to RSVP for in-person attendance at the Department of City Planning’s offices (120 Broadway, New York, NY 10271).

A school “colocation” occurs when two or more public schools share the same school building or campus. They have long been a part of the city’s public schools, but increased rapidly under the Bloomberg and subsequent administrations, mirroring the rise of charter schools and the small schools movement.

In this session, we present a look at the state of colocations in our schools through the lens of open data. We look at colocations from the perspective of changing neighborhood demographics represented in US Census data, as well as school demographic and academic data gathered from NYC Open Data datasets. We consider how and when schools thrive as colocations and when they suffer or present inequities.

During our presentation, we will discuss the background and driving questions for our research and our findings, but we will also demonstrate our methods and approach (and code) used to work with open geospatial data.

We follow our presentation with a workshop demonstrating new ways to plot overlapping spaces on data driven maps using the Python programming language. Our team will work with participants to code their own maps that investigate various aspects of school buildings and colocations. Participants of all levels are welcome.

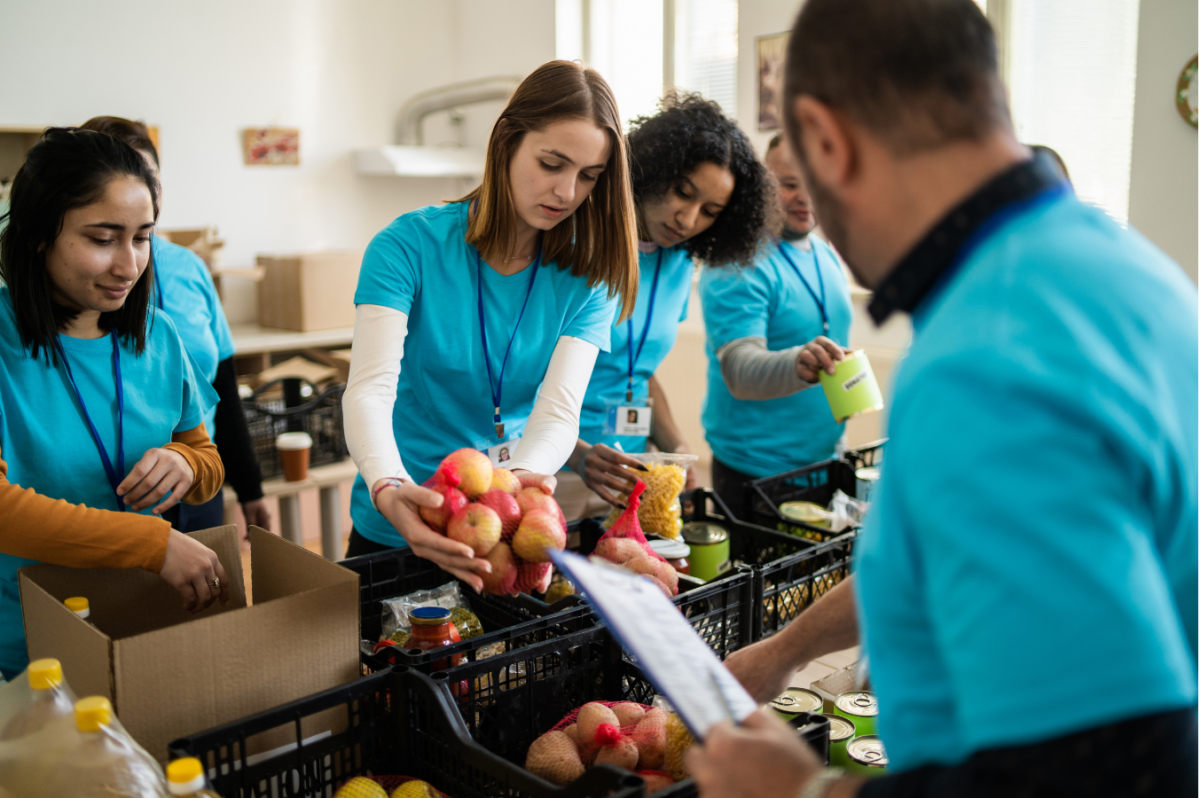
Annually, NYC community-based organizations and the City government work to supply millions of pounds of food directed toward people in need through the Community Food Connection Program. Determining how to distribute limited resources to where they are needed the most, the City leverages data-driven approaches to bring food to those in need using the Supply Gap Analysis. In this workshop, you’ll learn how data insights can shape decision-making, collaboration and support organizers like you to make more informed decisions that facilitate food security for our communities.

Led by the NYC Mayor’s Office of Food Policy, this session will include guests from the Mayor’s Office for Economic Opportunity & Community Food Connection Administrators, whose work supports over 700 food pantries and soup kitchens across the city, leveraging insights from the supply gap analysis in areas of unmet need.

Ideal for food security advocates, academics, students, data analysts and others interested in food-related issues and data, the workshop will provide answers to questions about neighborhood food security metrics, how need for emergency food is defined and measured, and how to leverage the dataset to support neighborhood and/or organizational strategies to close the gap. You will have a chance to interact with the Emergency Food Supply Gap dataset using NYC Open Data tools to pose your own strategic insights to support food security.

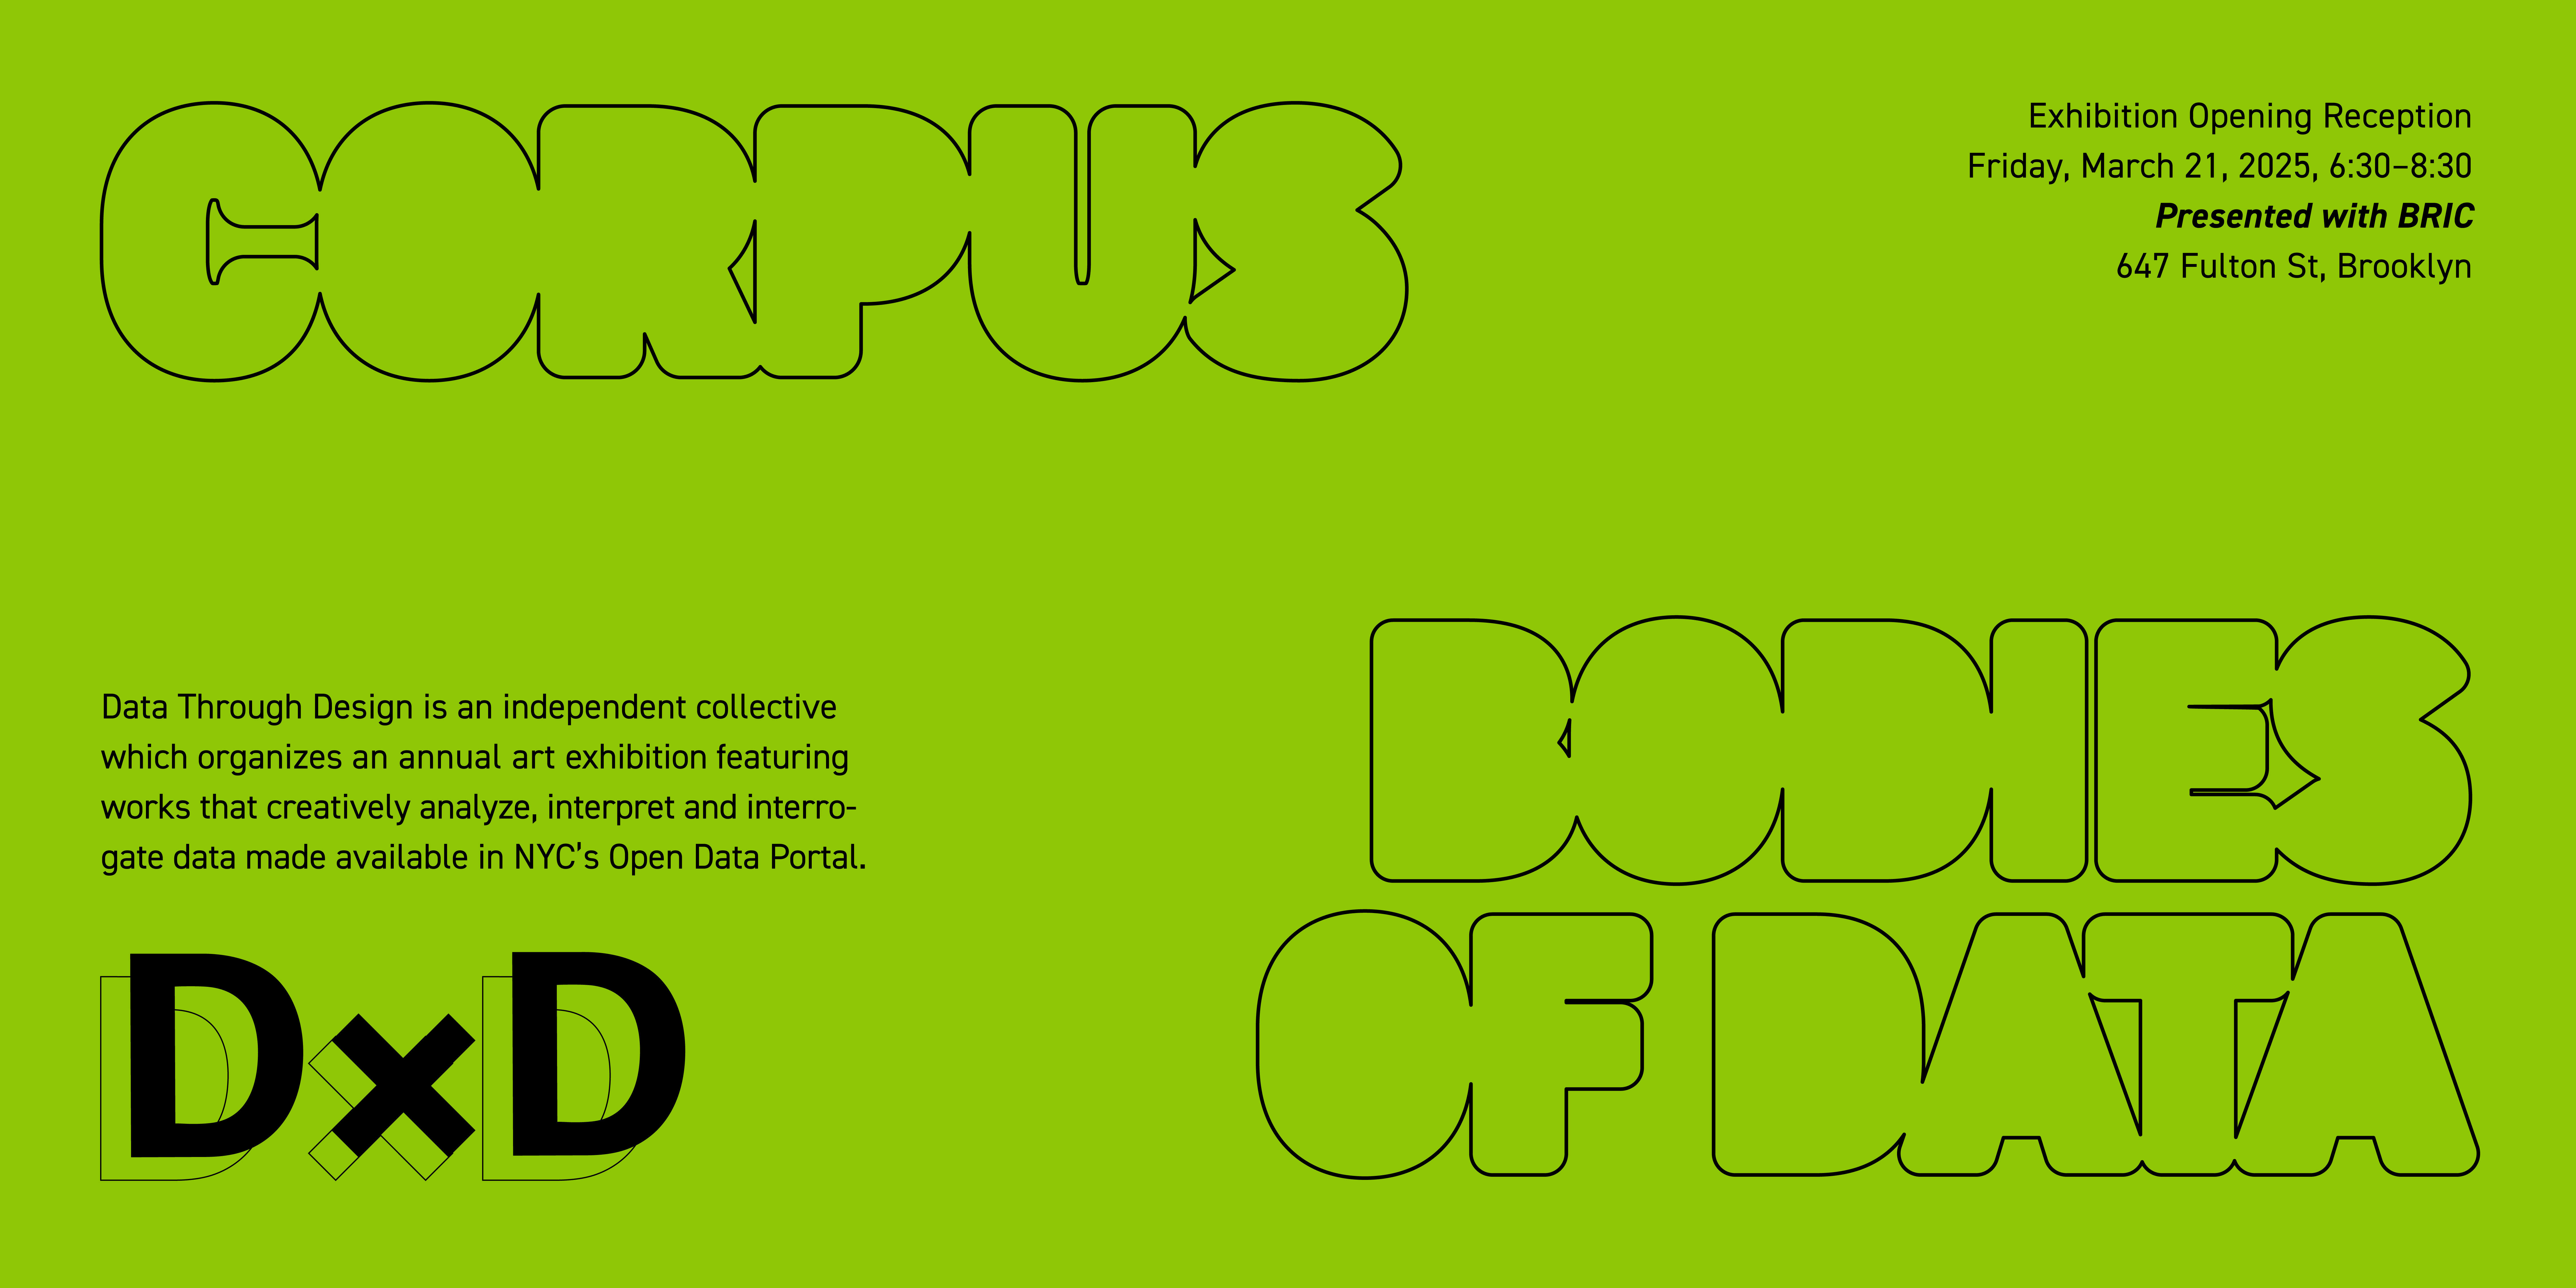
Data Through Design (DxD) is an independent, volunteer-run collective which organizes an annual art exhibition that creatively analyze, interpret and interrogate data made available on NYC Open Data. Each year a theme is developed to challenge artists to surface hidden stories, patterns, and connections in data; to examine its shortcomings; and to question claims to objectivity that data representations may project. These novel and artistic creations harness the potential for data to enliven and deepen our understanding of life in the city.

The exhibition will be presented in partnership with BRIC in Brooklyn, NY and is open to the public daily from 12 p.m. to 7 p.m. Learn more at datathroughdesign.com.

RSVP for the March 21 opening reception.

This year, DxD asked artists to think about the concept of a corpus, or body of data, that can be physical or ephemeral. We imagine a dataset as a body of knowledge that indexes people in a community, events in a timeline, or observations in an area. But datasets are also representations of our bodies and the corpora of living things; collections of individuals, bodies of water, natural and human-made systems, the collectivity of the city. How are these bodies of knowledge born, how do they age, grow, and go through cycles – who animates them and do they expire? And, if we look closely enough, can we discern the shapes of individuals within these collectives? For DxD’s 2025 exhibition, we encouraged participating artists to consider “corpus” through its multiple meanings, such as a body, a dataset, a community, and/or an organism.

2025 Artists and Projects
Elias Bennett, Simon Lesina-Debiasi: Final Inch: Mustard, Data, Sauerkraut
Mauricio Delfin: The Timelines Project
HK Dunston, Jill Sigman, Abigail Regner, Mariya Chekmarova: Breath Atlas
Michelle Hui: Aging Out of Place: Chinatown Elderly
Alison Long, Cass Yao, Keyarow Mosley: Body of Waste
Matías Piña, Arden Schager: Hyperphagia
Natch Quinn: The Entirety of NYC Land
Nishra Ranpura: Tapestreet: The Fabric of NYC
Aida Razavilar, Paul Hanna: Tower of Babel: Bodies of Language in Lexicon
Jessica Reisch: Marsh Temporalities

Data Through Design (DxD) is an independent, volunteer-run collective which organizes an annual art exhibition that creatively analyze, interpret and interrogate data made available on NYC Open Data. Each year a theme is developed to challenge artists to surface hidden stories, patterns, and connections in data; to examine its shortcomings; and to question claims to objectivity that data representations may project. These novel and artistic creations harness the potential for data to enliven and deepen our understanding of life in the city. The exhibition will be presented in partnership with BRIC in Brooklyn, NY and is open to the public daily from 12 p.m. to 7 p.m. Learn more at datathroughdesign.com.

This year, DxD asked artists to think about the concept of a corpus, or body of data, that can be physical or ephemeral. We imagine a dataset as a body of knowledge that indexes people in a community, events in a timeline, or observations in an area. But datasets are also representations of our bodies and the corpora of living things; collections of individuals, bodies of water, natural and human-made systems, the collectivity of the city. How are these bodies of knowledge born, how do they age, grow, and go through cycles – who animates them and do they expire? And, if we look closely enough, can we discern the shapes of individuals within these collectives? For DxD’s 2025 exhibition, we encouraged participating artists to consider “corpus” through its multiple meanings, such as a body, a dataset, a community, and/or an organism.

2025 Artists and Projects
Elias Bennett, Simon Lesina-Debiasi: Final Inch: Mustard, Data, Sauerkraut
Mauricio Delfin: The Timelines Project
HK Dunston, Jill Sigman, Abigail Regner, Mariya Chekmarova: Breath Atlas
Michelle Hui: Aging Out of Place: Chinatown Elderly
Alison Long, Cass Yao, Keyarow Mosley: Body of Waste
Matías Piña, Arden Schager: Hyperphagia
Natch Quinn: The Entirety of NYC Land
Nishra Ranpura: Tapestreet: The Fabric of NYC
Aida Razavilar, Paul Hanna: Tower of Babel: Bodies of Language in Lexicon
Jessica Reisch: Marsh Temporalities
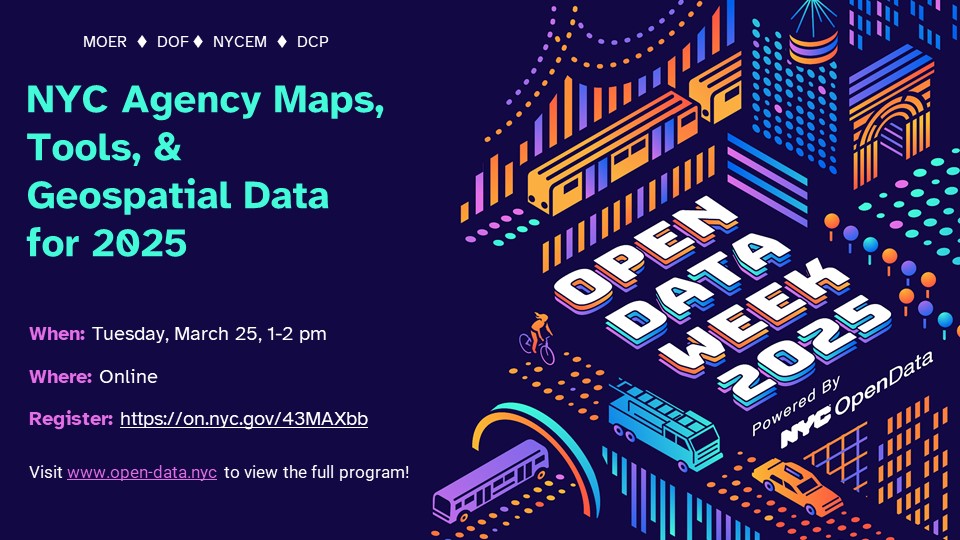
New York City agencies create and publish a huge volume of geospatial data each year. They use Geographic Information Systems (GIS) – computer-based tools to store, visualize, and analyze this geographic data. This panel will review publicly-available tools and datasets, discuss the state of GIS technology in the city, and consider how the City uses geospatial data to serve NYC residents.
Join this conversation with agency GIS leaders about new maps & tools, geospatial data, and initiatives for 2025.

Moderator
Lee Ilan, NYC Mayor’s Office of Environmental Remediation

Panelists
Josh Friedman, NYC Emergency Management
Matt Croswell, NYC Department of City Planning
Carmela Quintos, NYC Department of Finance
Angel Adhikari, NYC Department of Finance


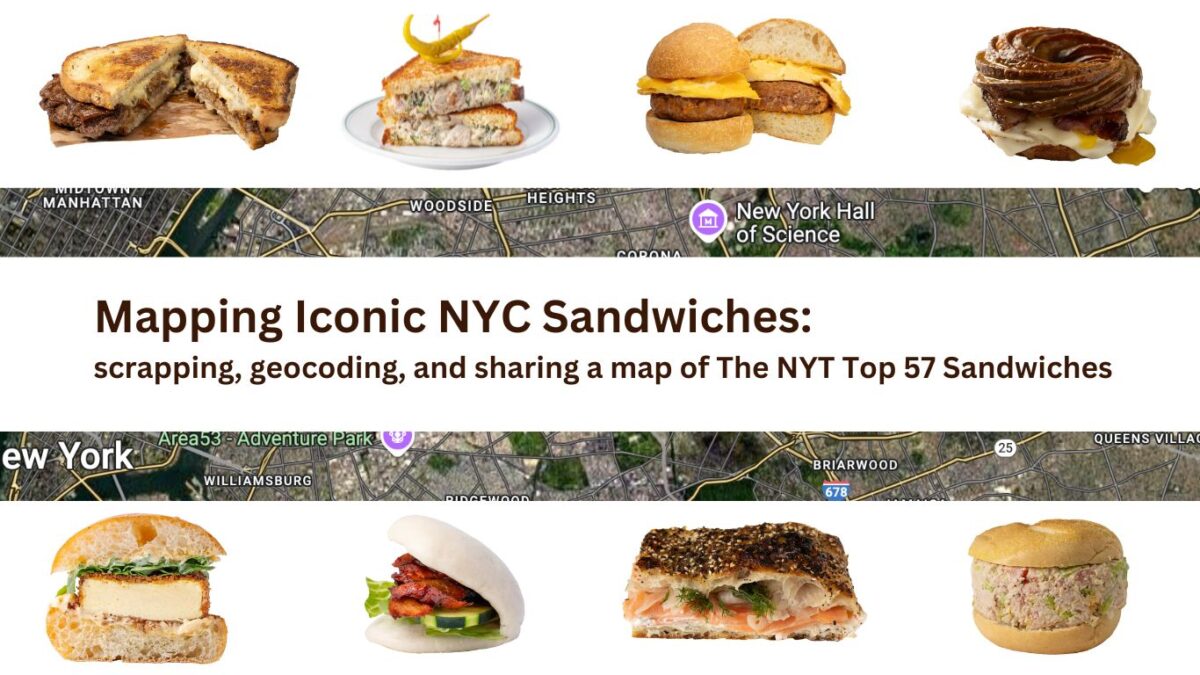
Sandwiches are my passion. When the New York Times unveiled its list of 57 sandwiches that define New York City, I wanted to try them all. The problem: the NYT list only provides sandwich names and restaurant addresses. Determining if I’m near an iconic sandwich requires scrolling, reading, and flipping between the list and Google Maps. The solution: I need a sandwich map!

In this workshop, rather than just traditional coding, we’ll use a large language model (LLM) as a pair programming partner to help us tackle challenges, offer suggestions, and streamline the development process. By the end, you’ll know how to combine basic Python coding with web scraping, Google Maps, and GitHub Pages.

The Health Department provides interactive visualization tools, downloadable datasets, and rigorous research on New Yorkers’ health. Learn how to use these resources to support your own research, and to inform advocacy, programming, and policy.

Resources covered include:
* EpiQuery
* Environment and Health Data Portal                             
* Community Health Profiles
* NYC Open Data datasets from the Health Department
* Data pages on Covid-19 and Vital Statistics

Join F.Y.Eye, a NYC-based nonprofit media agency that works with nonprofit clients, to explore how to harness the power of data to create powerful Public Service Announcements (PSAs). Learn about the importance of information access, how to identify relevant datasets, and craft impactful narratives that resonate with your target audience. We’ll cover practical strategies for transforming raw data into powerful messages that drive social change and amplify your organization’s mission. This event is for anyone curious about the power of combining data insights with compelling storytelling to amplify messages for the public good.