Launched in 2022 as a collaboration between the Queens Memory Project at Queens Public Library and Urban Archive, the Queens Name Explorer is an interactive map with biographical profiles and personal remembrances spanning more than 1,200 places in the borough of Queens. Drawing on data from NYC’s Department of Parks, Department of Transportation, and others, the project offers a user-friendly way to explore local history, from looking up people by name or characteristics (such as by roles like musicians, activists, and politicians), “touring” a neighborhood and clicking on profiles, and using the information on the map to consider how practices of commemoration include and exclude individuals, communities, and their stories.
In this session, participants will gain insight into how civic data sources, original research, and public contributions can be used to highlight local history through creative approaches to personal biography.
Following this introduction, participants will be guided through a series of prompts to think about how named places can be a starting point for further explorations into local history. Participants will dig into the Name Explorer and consider how creative uses of civic data and research can be used for learning and commemoration.
Join nonprofits JustFix and University Neighborhood Housing Program (UNHP) for a virtual presentation on how they used open data and open-source community tools to build a dashboard that supports tenant organizing in buildings impacted by the collapse of Signature Bank.

Signature Bank financed some of the city’s worst slumlords for years, underwriting their unscrupulous business practices premised on neglect, displacement, and deregulation of rent-stabilized apartments. The bank collapsed in 2023 and the FDIC took over the mortgages for 2,000+ buildings with over 30,000 units of rent-stabilized housing. This changed the incentives to make it possible to hold landlords accountable and allow tenants to use their power in new ways to get meaningful repairs made and even take control of their buildings through collective ownership models.

Ana Peña (Community Research & Data Analyst at UNHP) and Maxwell Austensen (Software Engineer at JustFix) will share the background on Signature Bank and opportunities presented in the wake of its collapse, how they worked with various stakeholders to guide the project, how they used open data and open-source tools to create the data dashboard, and how tenants, organizers, and other groups are utilizing the dashboard to build power and improve housing conditions.

This presentation is open to all, requires no specialized knowledge or skills, and might be most relevant to:
– NYC tenants interested in the situation with Signature Bank and how data can support organizing
– Government agency workers interested in seeing how their open data can be used for good.
– Civic tech enthusiasts interested in ways to access and utilize open data in new ways.

Each year, dozens of news articles (and more school projects, data stories, and research papers than we know about!) are written using data from the Mayor’s Management Report (MMR). This report has been published twice a year since the 1970s, and data since 2016 is available in an Open Data set and an interactive tool called the Dynamic Mayor’s Management Report. In this presentation, analysts who compile the MMR at the Mayor’s Office of Operations will show you the data behind the news stories. We’ll walk you through using public data to identify trends that are relevant to public interest, and how to find multiple data points related to the same theme so you can see the broader picture. This event is an introduction to a specific dataset and various uses, and is suitable for anyone with interest in this topic, regardless of technical skill. Anyone who is interested in creating narratives or data stories for school or public use, or who is interested in understanding how data makes it from City agencies to the pages of a newspaper, is welcome to attend.

CUNY Tech Prep fellows will demo three projects from their fellowship year:

  • Team Slice Scout (Matthew, Jack, Rei, and Tor) will share their full-stack web application that tracks and categorizes NYC pizza prices, utilizing React, TypeScript, Express.js, and PostgreSQL.
  • Team Subway Surfers (Arihant, Md, and Zara) will share their data science dashboard that visualizes station-specific crime trends across NYC using Python and Streamlit.
  • Additional fellows from across Tech Prep’s Web Development and Data Science tracks will present their insights from a new “Mastering Spreadsheets” lecture that uses Open Data APIs to bring data into Google Sheets.

Moderators and project mentors: Lead Instructor, Dr. Edgardo Molina | Data Science Instructor, Zack DeSario

Open to all who want to 1) meet CUNY entry-level talent and/or 2) learn more about how to use NYC Open Data resources in education and workforce development to help undergraduates land roles in technology.

Learn more about CUNY Tech Prep on our website! cunytechprep.org

Join Data Dissemination Specialist Joli Golden to explore easy to use tools like QuickFacts and Census Narrative Profiles to find free local data to leverage in your grant proposals. See how to access the most current and relevant demographic statistics from the American Community Survey and the 2020 Census in data.census.gov. Take a look at how using different levels of geography in your searches and easy to create thematic maps can help you to build a more compelling case for grants. This training is recommended for all data users.

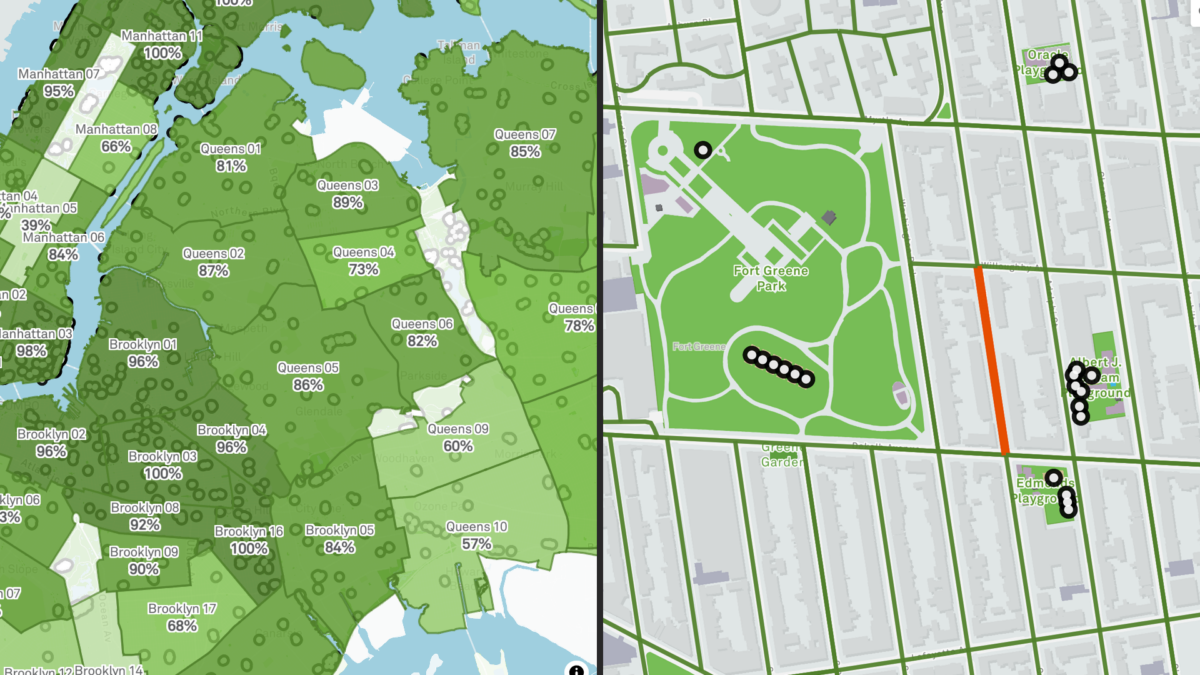
Have you ever wondered how parks in your neighborhood compare with others? Meet the Vital Parks Explorer! In this session, the Innovation & Performance Management (IPM) team from NYC Parks will share some highlights of how this public-facing tool was built. The Explorer visualizes access to parks amenities and services across the city. From inception and prototype, to public release, three data professionals working in local government will give you a behind-the-scenes look at how data, analysis, visualization, and user experience considerations shaped the final product. This event is for all New Yorkers who care about parks and might be of particular interest to advocates of public spaces, civic data enthusiasts, web app developers, designers, geospatial data scientists and engineers. We look forward to your participation and feedback!

Speaker bios:
Lilian Chin is a Data Analytics Specialist on Parks’ IPM team, where she has worked since September 2023. As part of IPM, she supports a wide-range of data-driven initiatives for Parks’ Maintenance and Operations. This includes visualizing the Work Order backlog, streamlining data pipelines for park assets, developing methodologies for the Park Condition Score, building in-house dashboards, and improving data quality and documentation.

Kate Sales is a Data Analytics Specialist on Parks’ IPM team. In the last year, she has worked on projects that touch many aspects of Parks including collecting and combining volunteer data for the Let’s Green NYC initiative, creating dashboards for Vital Parks for All, and helping others learn how to visualize data. Before Parks, Kate was a GIS analyst at the urban planning consulting firm Urban3 in Asheville, NC, her hometown. She recently completed her Master of Urban Planning at CUNY Hunter College and earned her BA in geography at Macalester College.

Benno Mirabelli is a Data Scientist on Parks’ IPM team. He works on various data analysis, reporting, research, and optimization projects. Some examples of his ongoing work include the routing analysis based on LION data for the recently released Vital Parks Explorer, research on understanding usership patterns and visitor volume at parks, and new management tools that assist with grass maintenance, planning, seasonal worker assignments and more. He holds a PhD in Applied and Computational Mathematics.

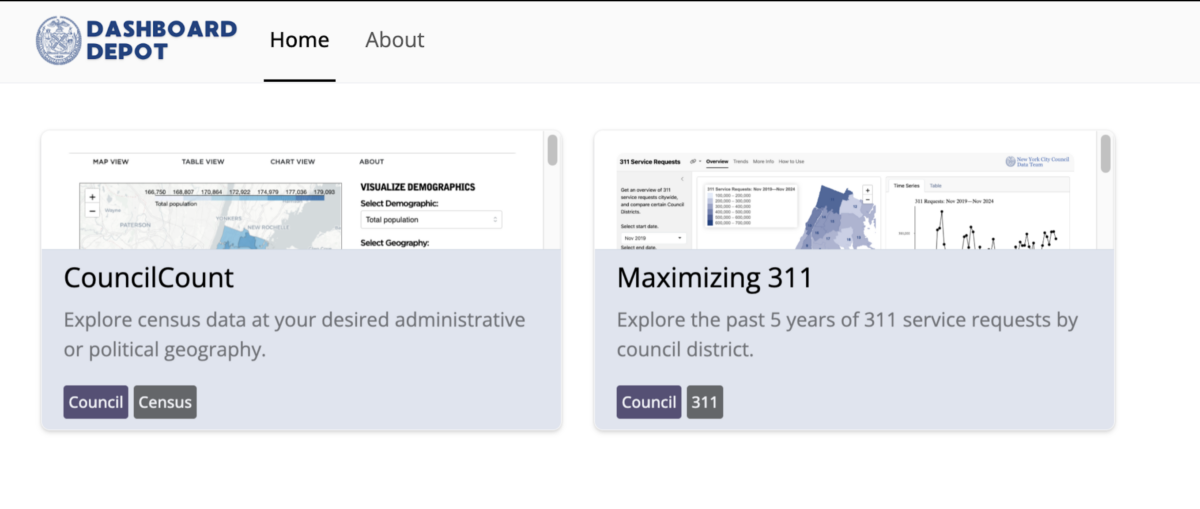
This session unveils two dashboards developed by the New York City Council Data team to transform large public datasets into accessible, actionable tools for the City Council. The CouncilCount and Max311 dashboards use data from the U.S. Census and NYC’s 311 Service Requests to offer insights tailored to the unique needs of each Council District.

Join us if you’re curious about creating dashboards for the public good, transforming large datasets into simple visuals, and delivering insights to decision-makers.

During this event, we will walk attendees through the dashboard development process. The CouncilCount dashboard provides demographic, socioeconomic, and other census data, curated specifically to help Council members better understand and serve their communities. Max311, on the other hand, leverages 311 Service Requests to track and analyze trends in community concerns, complaints, and issues reported by district.

The event will be a mix of presentation, live demo, and Q&A. We’ll start with an overview of the Council’s goals and challenges around public data, followed by a walkthrough of each dashboard. After demonstrating specific use cases, we’ll open the floor to questions and discussion on using open data for local government insights.