The NYC Independent Budget Office (IBO) aims to enhance understanding of New York City’s budget, public policy, and economy through independent analysis. We leverage Open Data in numerous ways to achieve this goal. IBO researchers will present 3 separate projects:

– Brian Cain (Assistant Director) & Jordan Paige (Budget and Policy Analyst) modeled the cost and burden of potential stormwater fees in NYC using geographic data;

– Valerie Gudino (Budget and Policy Analyst) researched IBO police overtime trends, specifically the relationship between NYPD tenure and hours of OT usage of uniform NYPD personnel in fiscal year 2024 using tabular data; finally,

– Emma Gossett (Budget and Policy Analyst) compiled NYC Education Indicators using Department of Education student-level data that is now available in the aggregate as a public resource.

This event is perfect for anyone interested in data-driven policy analysis, or the specific areas of environmental, public safety, or education policy. IBO will present all three projects then take audience questions.

DataKind started 2024 with an ambitious goal: to create an open-access tool populated with data at a hyperlocal level that would foster a deeper understanding of community needs and the complex factors influencing them. Working with collaborators representing many facets of health and wellbeing, DataKind launched the community health indicators software, a tool which enables social service providers, practitioners, policymakers and community stakeholders to access standardized data on their communities of impact and take meaningful action. This resource harmonizes and makes accessible 11 different public data sources of community data at three geographic levels (tract, zip, and county), with 49 unique data indicators drawing from a database of six million rows of data. Users have the option to create a free, secure individual or team account and upload and analyze additional datasets alongside the data included. Users can export analysis, including maps, from the system. This free and open software makes data insights accessible to any end-user regardless of data maturity.

This session will discuss the community-centered software design process, demonstrate the software with several use cases, and offer a rich, facilitated conversation with end-users of the software from social impact and governmental institutions. We will provide an introduction to question formulation, asset mapping, and data interpretation.

Attendees can submit their data questions here for use in the session or for future follow-up: https://forms.gle/TsWfe4Dses3jzVHm8

“Once architects realize that climate change is a quantity measured in carbon, it becomes a simple design constraint just like gravity, easily mitigated by designing form and performance simultaneously.” – NYIT Professor Clarke Snell

During this virtual event, architecture educators and a librarian provide information about building performance and simulation which calls on open data sources that students analyze to inform their design decisions. We developed educational modules introducing undergraduate students to measuring environmental conditions and relevant open data projects to assess climatic challenges alongside building performance projections. We develop design thinking to improve built environments that require less energy to build and operate. Professionals are increasingly interpreting climatic conditions from original and publicly available data at all phases of design and construction. Architecture students learn to observe and interpret measured and simulated building performance, interpret local code, laws and guidelines (ie Local Law 33; 97) and measure indoor/exterior environments. These practices develop students’ sensitivity to design decisions and adaptive solutions.

One education module presents a hands-on introduction to the variables that define and differentiate indoor and outdoor environments through measurements and analysis using sensors and apps. Participants measure the dry bulb temperature, relative humidity, and dew point of the environment they encounter for three days, then compare the results for the same days for several other measured environments. These include the interior and exterior conditions of our library where we maintain a weather station and indoor sensor network. The weather station also broadcasts data to the National Weather Service through the Citizens Weather Observation Program (CWOP). To conclude this presentation, we will share information about tools, assessments, and conclusions from the first sessions as well as modules in development.

Please join us for a practical introduction to the evolution of building performance in the architecture profession and design education. Attendees will gain access to learning objects and exercises about building performance and citizen science opportunities in your classroom. While our students are undergraduate and graduate students, we provide information on tools that can align with younger students or the public.

NYC School of Data is a community conference that demystifies the policies and practices around open data, technology, and service design. This year’s conference helps conclude NYC Open Data Week and features 30+ sessions organized by NYC’s civic technology, data, and design community! Our conversations and workshops will feed your mind and inspire you to improve your neighborhood.

To attend, you need to purchase tickets. The venue is accessible, and the content is all-ages friendly! If you have accessibility questions or needs, please email us at schoolofdata@beta.nyc.

Thank you to Reinvent Albany and Esri for helping to cover conference costs and making it possible to meet in 2025.

And If you can’t join us in person, tune into the main stage live stream provided by the Internet Society New York Chapter. Follow the conversation #nycsodata on Bluesky.

Purchase your tickets here.

A school “colocation” occurs when two or more public schools share the same school building or campus. They have long been a part of the city’s public schools, but increased rapidly under the Bloomberg and subsequent administrations, mirroring the rise of charter schools and the small schools movement.

In this session, we present a look at the state of colocations in our schools through the lens of open data. We look at colocations from the perspective of changing neighborhood demographics represented in US Census data, as well as school demographic and academic data gathered from NYC Open Data datasets. We consider how and when schools thrive as colocations and when they suffer or present inequities.

During our presentation, we will discuss the background and driving questions for our research and our findings, but we will also demonstrate our methods and approach (and code) used to work with open geospatial data.

We follow our presentation with a workshop demonstrating new ways to plot overlapping spaces on data driven maps using the Python programming language. Our team will work with participants to code their own maps that investigate various aspects of school buildings and colocations. Participants of all levels are welcome.

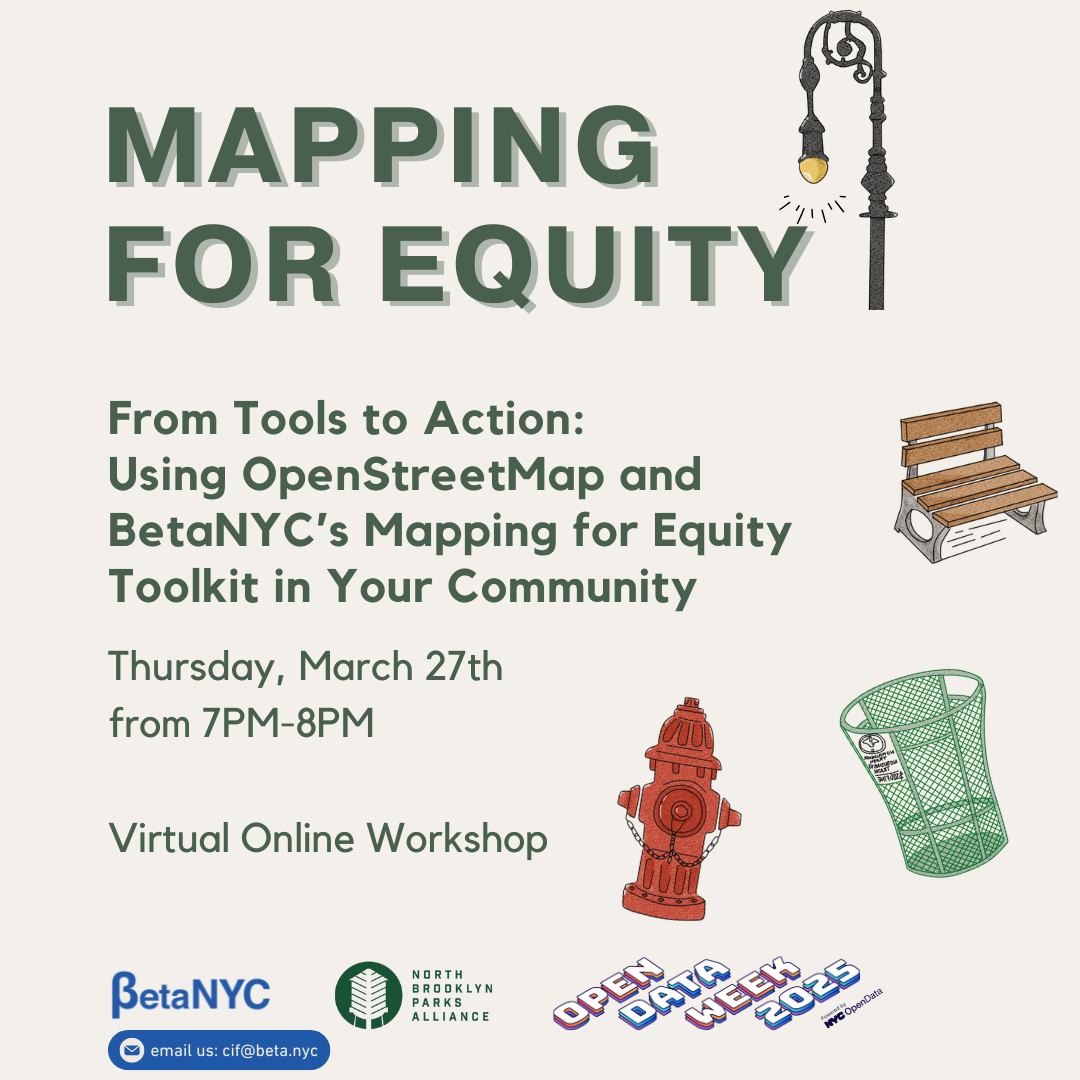
Join us for an interactive virtual session where we’ll introduce you to BetaNYC’s Mapping for Equity (M4E) Toolkit—a resource for learning and teaching OpenStreetMap (OSM) and organizing Mapping for Equity events. M4E is a civics and data literacy program that empowers participants to see, collect, and analyze data on New York City’s under-mapped and underrepresented public spaces, making communities more visible and equitable.

Who Should Attend?
This session is designed for community leaders, educators, advocates, and organizers who want to bring civic tech and data literacy to their neighborhoods, classrooms, and organizations. Whether you’re new to mapping or an experienced data practitioner, you’ll gain the skills to integrate mapping into your work and mobilize your community for action.

What You’ll Gain
– Comprehensive toolkit access – Receive the full set of materials needed to host and facilitate Mapping for Equity events in your community.
– A network of fellow mappers and advocates – Connect with community leaders committed to using mapping for equity.
– Ongoing collaboration and accountability – Participation in this session is just the first step. Attendees are expected to stay engaged through office hours, follow-up discussions, and applying the toolkit in their communities.

Beyond the Session: Ongoing Support & Certification
Our collaboration doesn’t end when the session does! Here’s how we’ll continue to support you:
✅ Scheduled Office Hours – Participants must book time with our team to troubleshoot challenges and receive support as they implement the toolkit.
✅ Ongoing Engagement – Regular check-ins and communication are required to ensure accountability, provide guidance, and foster a collaborative learning community.
✅ Evaluation & Improvement – Participants will be asked to provide structured feedback to help refine and enhance the toolkit.
✅ Certification – Earn a Public Interest Mapping Advocate Certification from BetaNYC upon completing the required steps of the program.

This is more than a workshop—it’s the beginning of a community movement to create maps that empower, educate, and drive change. Join us and start mapping for equity today!

Anyone who uses data to make decisions must possess certain critical thinking skills that go beyond mere technical craft. But, what are these skills exactly? Join CUNY professor Eldar Sarajlic in a lecture about Critical Data Literacy, a philosophical approach to reasoning with data. You will learn about the conceptual background of thinking with data and have the opportunity to test your data-reasoning skills.

This talk is for anyone who plans to access open data and make any kind of arguments or claims based on the data. The hope is that you will walk away with a stronger toolkit to think about what a dataset means and does not and be better equipped to avoid fallacies of inference.

CUNY Tech Prep fellows will demo three projects from their fellowship year:

  • Team Slice Scout (Matthew, Jack, Rei, and Tor) will share their full-stack web application that tracks and categorizes NYC pizza prices, utilizing React, TypeScript, Express.js, and PostgreSQL.
  • Team Subway Surfers (Arihant, Md, and Zara) will share their data science dashboard that visualizes station-specific crime trends across NYC using Python and Streamlit.
  • Additional fellows from across Tech Prep’s Web Development and Data Science tracks will present their insights from a new “Mastering Spreadsheets” lecture that uses Open Data APIs to bring data into Google Sheets.

Moderators and project mentors: Lead Instructor, Dr. Edgardo Molina | Data Science Instructor, Zack DeSario

Open to all who want to 1) meet CUNY entry-level talent and/or 2) learn more about how to use NYC Open Data resources in education and workforce development to help undergraduates land roles in technology.

Learn more about CUNY Tech Prep on our website! cunytechprep.org