The NYC Independent Budget Office (IBO) aims to enhance understanding of New York City’s budget, public policy, and economy through independent analysis. We leverage Open Data in numerous ways to achieve this goal. IBO researchers will present 3 separate projects:

– Brian Cain (Assistant Director) & Jordan Paige (Budget and Policy Analyst) modeled the cost and burden of potential stormwater fees in NYC using geographic data;

– Valerie Gudino (Budget and Policy Analyst) researched IBO police overtime trends, specifically the relationship between NYPD tenure and hours of OT usage of uniform NYPD personnel in fiscal year 2024 using tabular data; finally,

– Emma Gossett (Budget and Policy Analyst) compiled NYC Education Indicators using Department of Education student-level data that is now available in the aggregate as a public resource.

This event is perfect for anyone interested in data-driven policy analysis, or the specific areas of environmental, public safety, or education policy. IBO will present all three projects then take audience questions.

In this presentation, we will introduce our recently developed urban heat portal for NYC. We will demonstrate how each layer in the heat portal is prepared. We used a variety of resources to prepare urban heat layers. They include:

  • Satellite data from Landsat 8 and 9
  • Weather Station Data from Visual Crossing
  • A variety of layers from City’s open data including Land Cover (Tree cover and permeable surface cover), NTA, Parks, buildings.

In this presentation, you will learn about the science of urban heat and the methods used for producing multiple layers that are publicly available for download. We will explain the workflow and the models that are developed to create Mean Radiant Temperature, Air Temperature, Heat Index, and an overall Outdoor Heat Exposure index.

This event will be hybrid.

For in-person attendance at Hunter College, please RSVP in advance using the “Going” button below, as front desk security will need a list of attendees in advance. Please arrive 15 minutes in advance to get a pass.

For virtual attendance, please RSVP using this link.

DataKind started 2024 with an ambitious goal: to create an open-access tool populated with data at a hyperlocal level that would foster a deeper understanding of community needs and the complex factors influencing them. Working with collaborators representing many facets of health and wellbeing, DataKind launched the community health indicators software, a tool which enables social service providers, practitioners, policymakers and community stakeholders to access standardized data on their communities of impact and take meaningful action. This resource harmonizes and makes accessible 11 different public data sources of community data at three geographic levels (tract, zip, and county), with 49 unique data indicators drawing from a database of six million rows of data. Users have the option to create a free, secure individual or team account and upload and analyze additional datasets alongside the data included. Users can export analysis, including maps, from the system. This free and open software makes data insights accessible to any end-user regardless of data maturity.

This session will discuss the community-centered software design process, demonstrate the software with several use cases, and offer a rich, facilitated conversation with end-users of the software from social impact and governmental institutions. We will provide an introduction to question formulation, asset mapping, and data interpretation.

Attendees can submit their data questions here for use in the session or for future follow-up: https://forms.gle/TsWfe4Dses3jzVHm8

Come to the NYC Office of Technology & Innovation offices on Friday, March 28 at 6PM for a lightning talk showcase, featuring open data use cases about the human brain, the environment, web domains, trash cans, and film locations. Each of the presenters will have a few minutes to showcase their work, and this will be followed by an audience question-and-answer period.

The presentations:

Arianna Zuanazzi – Exploring Child and Adolescent Mental Health in NYC: Insights from the Healthy Brain Network Open Dataset
The Healthy Brain Network (HBN) is a large-scale open science initiative of the Child Mind Institute which releases multimodal datasets capturing a broad range of clinical psychopathology in children and adolescents based in NYC. For this event, we will briefly introduce the openly available phenotypic and neuroimaging HBN datasets and present data and visualizations that illustrate socio-economic status, neighborhood crime and safety, school risk, and mental health in NYC children and adolescents. We will then explore how the HBN dataset can be combined with datasets from NYC Open Data, such as air quality and pollution data.

Surbhi Agrawal – Using Open Data to Map Regional Resiliency Risk and Assets
Sasaki Associates has developed a data platform to empower communities in mapping and understanding regional risks from natural hazards and stressors, alongside identifying critical community assets. Using open datasets, this platform visualizes data such as expected losses to populations, infrastructure, and agriculture, enabling informed decision-making for resilience planning.

Frank Noirot – Mapping the trash can landscape in NYC with QGIS and Open Data
I wondered how far people had to walk to the nearest litter basket anywhere in NYC, and thanks to NYC Open Data I was able to make a map that does just that, even though I’m no data scientist! I wrote about my process in making the map. I want to encourage others who have questions about the environment they live in to take a search through NYC Open Data to see if there is a data set that fits their topic. They might be pleasantly surprised with what they find.

Bailey Kane – Enriching NYC Open Data for .nyc Websites
All .nyc domain registrations since the beginning of the program are logged in a NYC Open Data dataset. However, actual use of those registered domains is not tracked. I was curious how people are using .nyc domains, so I started AllOf.nyc to explore all registered .nyc websites by expanding upon the data offered in the NYC Open Data dataset.

Cory D. Reeves – Simulating Soundscapes: NYC Open Data for Amplified On-Site Film Location Selection
Filming in New York City presents unique challenges—permitting, logistics, and environmental sound control measures during production are some examples. Our award-winning prototype from Autodesk University 2024’s Design & Make Conference, Dynamo Day Hackathon leverages NYC Mayor’s Office of Media and Entertainment (MOME) structured film permit datasets within Autodesk Forma’s AI-powered noise analysis engine, creating real-time feasibility assessments to support film location selection. This solution enables production teams to evaluate potential filming sites more in-depth, and to-scale within dynamic, virtual 3D space before more costly on-location mobilization of film crews and production staff.

Make a night of it! Before the event, consider checking out the Data Through Design exhibition at BRIC (647 Fulton St, Brooklyn), which is a 10-15 minute walk from this event. Afterwards, join us for a happy hour a few blocks away at Sound & Fury Brewery and Kitchen (141 Lawrence St, Brooklyn).

By the end of this 60-to-90-minute data-driven, historically rich, Trash Can Lower East Side walking tour and networking event, participants will witness, hear and see how freely available, seemingly disparate data points can be leveraged by social organizations, businesses, community development agencies, entrepreneurs and students to generate new ideas and out-of-the-box thinking

Like deciphering secret messages, event participants will hear how data wranglers and on the ground researchers from Baruch College and New York University School of Professional Studies combined present and past data to create this data rich walk.

Inspired by litter can placement data from the Department of Sanitation, the walk will show how people can overlay unusual data sources, like the placement of trash cans, the health status of trees, the placement of monuments, museums and galleries, volunteer, civic engagement information, etc. to find places of interest, create new community gathering places, identify community needs, or even new places for food carts and businesses based on foot traffic.

The walk begins at 12pm at Kossar’s Bagels and Bialys at 375 Grand Street – near the corner of Grand and Essex Streets – winding through the Lower East side to Allen Street on the West and Ludlow Street on the East, ending at Loisaida located at 710 East 9th Street around 2pm. Networking and presentations will take place at Loisaida from 2pm to 3pm.

The walking tour research, data and route planning, and organization was done by the following people: Julia Ciesla (Baruch College), Sumedha Moturu (Baruch College) , Putri Prabowo (Baruch College), Daniel Magarino (Baruch College), Saral Tewari (Baruch College), Andrew Glasser (NYU School of Professional Studies), Moksha Shah (Baruch College), Dhruvi Desai (NYU SPS); Rafael Taiar (data scientist), and Joshua Moritz (Baruch College Lecturer, NYU SPS adjunct)

Reflective roof colors reduce roof temperatures, internal building temperatures, the Urban Heat Island Effect , and carbon emissions; improve air quality; and extend the lifespan of rooftops and HVAC equipment. This project, conducted by John Hocknell, a student at Hunter College, uses machine learning to detect these cool and warm rooftops, and use that information to assess potential energy savings.

This work is inspired by the NYC CoolRoofs Initiative to reduce NYC’s carbon footprint by painting rooftops white.

“Once architects realize that climate change is a quantity measured in carbon, it becomes a simple design constraint just like gravity, easily mitigated by designing form and performance simultaneously.” – NYIT Professor Clarke Snell

During this virtual event, architecture educators and a librarian provide information about building performance and simulation which calls on open data sources that students analyze to inform their design decisions. We developed educational modules introducing undergraduate students to measuring environmental conditions and relevant open data projects to assess climatic challenges alongside building performance projections. We develop design thinking to improve built environments that require less energy to build and operate. Professionals are increasingly interpreting climatic conditions from original and publicly available data at all phases of design and construction. Architecture students learn to observe and interpret measured and simulated building performance, interpret local code, laws and guidelines (ie Local Law 33; 97) and measure indoor/exterior environments. These practices develop students’ sensitivity to design decisions and adaptive solutions.

One education module presents a hands-on introduction to the variables that define and differentiate indoor and outdoor environments through measurements and analysis using sensors and apps. Participants measure the dry bulb temperature, relative humidity, and dew point of the environment they encounter for three days, then compare the results for the same days for several other measured environments. These include the interior and exterior conditions of our library where we maintain a weather station and indoor sensor network. The weather station also broadcasts data to the National Weather Service through the Citizens Weather Observation Program (CWOP). To conclude this presentation, we will share information about tools, assessments, and conclusions from the first sessions as well as modules in development.

Please join us for a practical introduction to the evolution of building performance in the architecture profession and design education. Attendees will gain access to learning objects and exercises about building performance and citizen science opportunities in your classroom. While our students are undergraduate and graduate students, we provide information on tools that can align with younger students or the public.

Join us for an exciting set of back-to-back presentations featuring Cornell Tech researchers and practitioners as they share their real-world applications of NYC Open Data. This session offers a unique opportunity to explore how open data is being leveraged to address urban challenges, improve decision-making, and drive innovation across a variety of fields. Participants will gain valuable insights from experts who are actively shaping the future of NYC through data-driven solutions.

This event is part of an Open Data Week series hosted by Cornell Tech— learn more below!

Presentations:
The ABCs of a PiTech Fellow: Artificial Intelligence (AI) & Natural Language Processing (NLP), Block Party & Community Boards
Breanna Green, PhD Candidate, Information Science, Cornell Tech

Data-driven analyses and optimization of 311 systems: Applications to NYC Parks
Zhi Liu, PhD Candidate, Operations Research and Information Engineering, Cornell Tech

Data analysis and modeling of public building construction in New York City
Sara Venkatraman, Senior Research Associate in Statistics, Weill Cornell Medical College

Democratizing Policy Counterfactuals with AI: A deep dive into Local Law 97, NYC’s groundbreaking law to cut carbon emissions in its largest buildings
Vianney Brandicourt, Urban Tech Fellow, Cornell Tech

Analyzing the effects of congestion pricing using Open Data
Nikhil Garg, Assistant Professor, Cornell Tech

Predictive Maintenance for NYC Subway Lines
Atmika Pai, MS Candidate, Information Systems, Jacobs Technion-Cornell
Bhoomika Mehta, MS Candidate, Information Systems, Jacobs Technion-Cornell

SenTree: Leveraging NYC Open Data to predict urban tree health
Rishabh Surendran, MBA Candidate, Johnson Cornell Tech
Shubham Arya, MBA Candidate, Johnson Cornell Tech

– – 
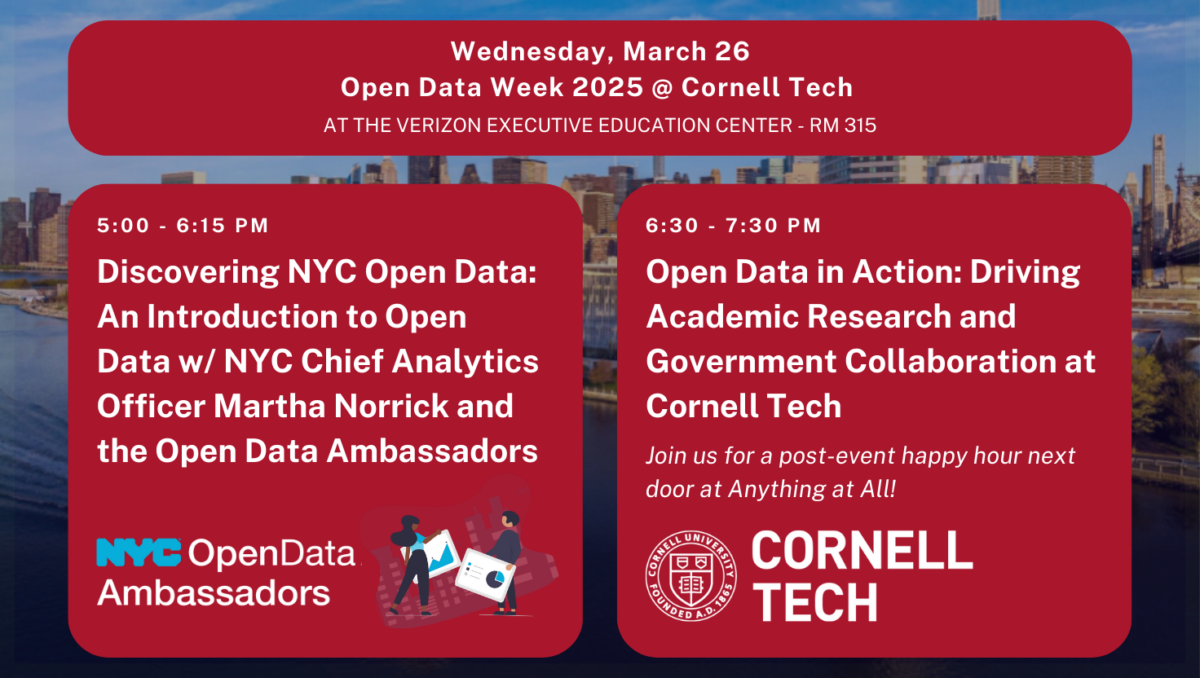
This event is part of an Open Data Week series hosted by Cornell Tech on Wednesday, March 26 from 5-8pm. We’d love for you to join us for both sessions— though it is not required! We’ll kick off at 5:00 pm with a hands-on Discovering NYC Open Data class from the Open Data Ambassadors, where you’ll learn the fundamentals of NYC Open Data. Following that, at 6:30 pm, Cornell Tech researchers and experts will discuss their real-world applications of open data, during Open Data in Action: Driving Academic Research and Government Collaboration at Cornell Tech. Join us for a post-event happy hour next door at Anything at All!

There are many easy ways to get to Cornell Tech, located on Roosevelt Island. For maps and directions see here.

NYC School of Data is a community conference that demystifies the policies and practices around open data, technology, and service design. This year’s conference helps conclude NYC Open Data Week and features 30+ sessions organized by NYC’s civic technology, data, and design community! Our conversations and workshops will feed your mind and inspire you to improve your neighborhood.

To attend, you need to purchase tickets. The venue is accessible, and the content is all-ages friendly! If you have accessibility questions or needs, please email us at schoolofdata@beta.nyc.

Thank you to Reinvent Albany and Esri for helping to cover conference costs and making it possible to meet in 2025.

And If you can’t join us in person, tune into the main stage live stream provided by the Internet Society New York Chapter. Follow the conversation #nycsodata on Bluesky.

Purchase your tickets here.

Join us for an interactive virtual session where we’ll introduce you to BetaNYC’s Mapping for Equity (M4E) Toolkit—a resource for learning and teaching OpenStreetMap (OSM) and organizing Mapping for Equity events. M4E is a civics and data literacy program that empowers participants to see, collect, and analyze data on New York City’s under-mapped and underrepresented public spaces, making communities more visible and equitable.

Who Should Attend?
This session is designed for community leaders, educators, advocates, and organizers who want to bring civic tech and data literacy to their neighborhoods, classrooms, and organizations. Whether you’re new to mapping or an experienced data practitioner, you’ll gain the skills to integrate mapping into your work and mobilize your community for action.

What You’ll Gain
– Comprehensive toolkit access – Receive the full set of materials needed to host and facilitate Mapping for Equity events in your community.
– A network of fellow mappers and advocates – Connect with community leaders committed to using mapping for equity.
– Ongoing collaboration and accountability – Participation in this session is just the first step. Attendees are expected to stay engaged through office hours, follow-up discussions, and applying the toolkit in their communities.

Beyond the Session: Ongoing Support & Certification
Our collaboration doesn’t end when the session does! Here’s how we’ll continue to support you:
✅ Scheduled Office Hours – Participants must book time with our team to troubleshoot challenges and receive support as they implement the toolkit.
✅ Ongoing Engagement – Regular check-ins and communication are required to ensure accountability, provide guidance, and foster a collaborative learning community.
✅ Evaluation & Improvement – Participants will be asked to provide structured feedback to help refine and enhance the toolkit.
✅ Certification – Earn a Public Interest Mapping Advocate Certification from BetaNYC upon completing the required steps of the program.

This is more than a workshop—it’s the beginning of a community movement to create maps that empower, educate, and drive change. Join us and start mapping for equity today!