Join this event to learn from NYC Emergency Management (NYCEM) about their role coordinating citywide emergency planning and response for all types and scales of emergencies, and how they use 311 data in both the response and recovery cycles of a disaster.
This virtual presentation will explore:
– The types of reporting products produced at NYCEM for different disaster cycles.
– A technical overview of our data collection process and data pipeline.
– The important role 311 data plays in different cycles of an emergency.
Tag: Government-led
Government-led events are hosted by government employee or office.
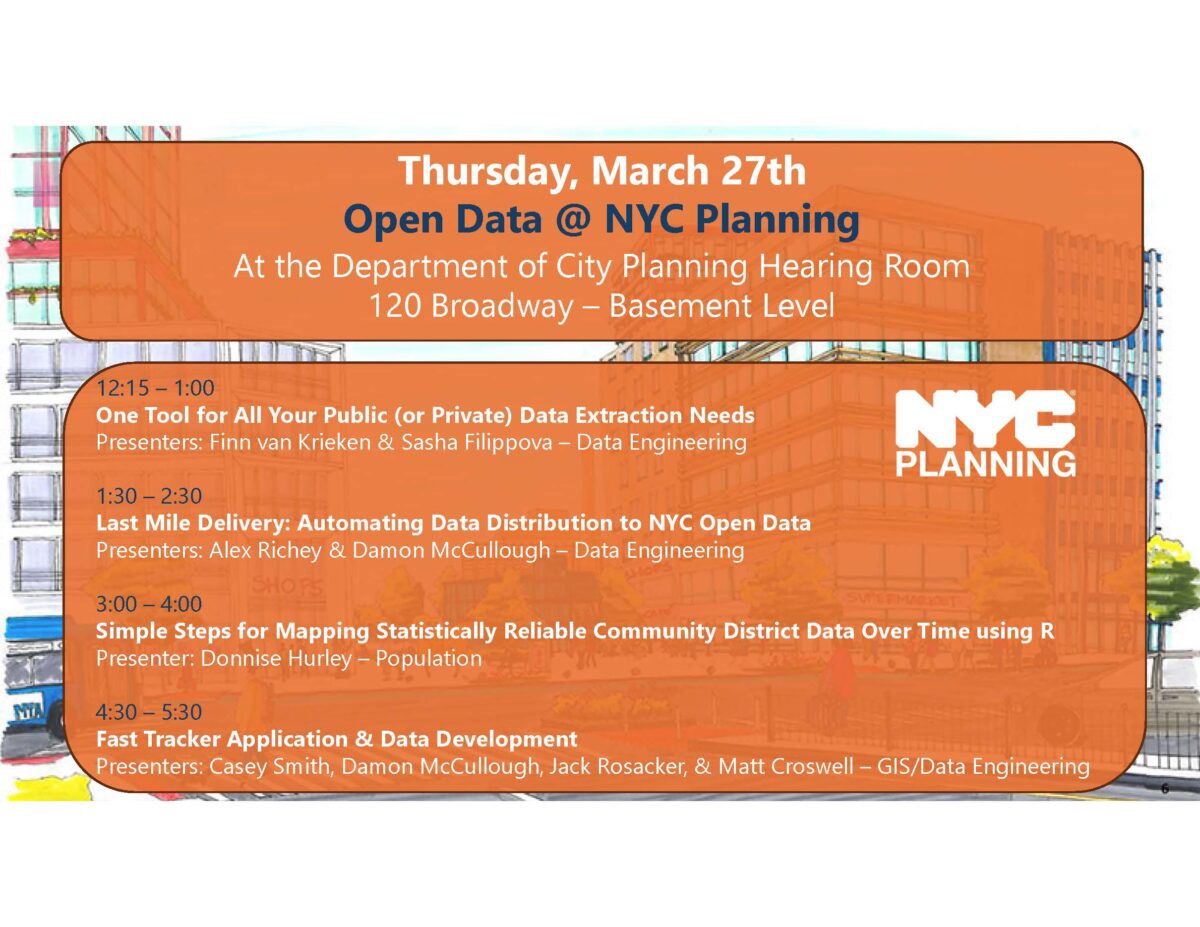
Comparing data from different census years can be a challenge due to changes in geographies. When those data are Public Use Microdata Sample (PUMS), it may be difficult to know where to start. In this presentation, Donnise Hurley from the NYC Department of City Planning will demonstrate step-by-step how to access PUMS data using the Census API, prepare data for analysis, harmonize older data into the 2020 PUMAs (approximate NYC’s Community Districts boundaries), and make an interactive map using a few lines of code. Attendees will gain a basic understanding of PUMS data, learn how to calculate margins of error and use them to create statistically reliable map categories, and learn data wrangling techniques. All analyses will be conducted in R statistical software, but the techniques presented are transferrable to other programs.
This presentation is part of the Open Data @ NYC Planning event series.
Click here to RSVP for virtual attendance.
Click the blue “Going” button below to RSVP for in-person attendance at the Department of City Planning’s offices (120 Broadway, New York, NY 10271).
This presentation will showcase the technical aspects of the Property Tax Forecasting included in New York City Council’s Economic and Tax Forecasting Report. The event will include an introduction to the revenue unit team, fundamentals of the property tax system, and the data collection and the forecasting model used. This report gets published by the New York City Council as part of the budgetary oversight three times a year.
The presenters are Dilara Dimnaku, Chief Economist at the New York City Council and Andrew Wilber, Supervising Economist at New York City Council Finance Division, Revenue Unit.
This event will be beneficial to other data science and analytics teams that are using similar data sources by providing use cases along with domain knowledge in housing and tax related administrative data. Participants will be able to ask questions at the end of the presentation.

Annually, NYC community-based organizations and the City government work to supply millions of pounds of food directed toward people in need through the Community Food Connection Program. Determining how to distribute limited resources to where they are needed the most, the City leverages data-driven approaches to bring food to those in need using the Supply Gap Analysis. In this workshop, you’ll learn how data insights can shape decision-making, collaboration and support organizers like you to make more informed decisions that facilitate food security for our communities.
Led by the NYC Mayor’s Office of Food Policy, this session will include guests from the Mayor’s Office for Economic Opportunity & Community Food Connection Administrators, whose work supports over 700 food pantries and soup kitchens across the city, leveraging insights from the supply gap analysis in areas of unmet need.
Ideal for food security advocates, academics, students, data analysts and others interested in food-related issues and data, the workshop will provide answers to questions about neighborhood food security metrics, how need for emergency food is defined and measured, and how to leverage the dataset to support neighborhood and/or organizational strategies to close the gap. You will have a chance to interact with the Emergency Food Supply Gap dataset using NYC Open Data tools to pose your own strategic insights to support food security.
Join us as we share lessons learned from applying GenAI and Natural Language Processing (NLP) to alternative data sources! We’ll walk through a project where we used Public Pulse Mining to evaluate how the public engages with the General Services Administration’s construction projects and better understand local stakeholder priorities and perceptions.
Then, we’ll dive into an interactive prompt engineering exercise using our master prompt templates for structuring unstructured data. You’ll gain practical takeaways on using AI for public engagement, including how to extract insights from free-text datasets like NYC public meeting YouTube transcripts, 311 feedback, and consumer complaints.
This session is open to all audiences, regardless of technical background. We’ll also share open-source tools and scripts on GitHub so you can apply these methods to your own datasets!
In this virtual training, MTA’s Data & Analytics Team will walk participants through how to pull big datasets from the open data portal via the API using Python. Participants will briefly learn a bit about MTA’s Open Data Program before being invited to follow along while the team demos how to pull MTA’s larger datasets off of the Socrata platform. While the data is pulling, the team will show some interesting analysis you’ll be able to do, centered around the Congestion Relief Zone!
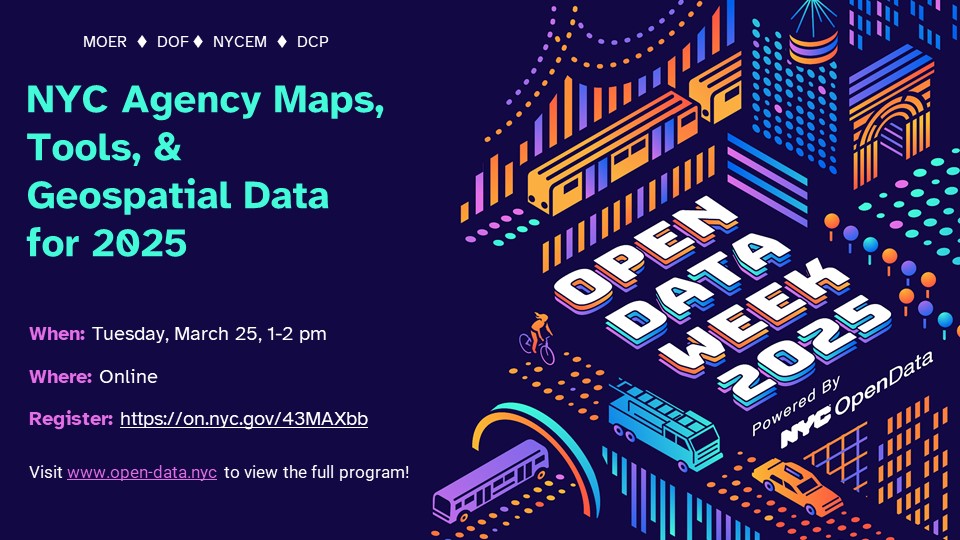
New York City agencies create and publish a huge volume of geospatial data each year. They use Geographic Information Systems (GIS) – computer-based tools to store, visualize, and analyze this geographic data. This panel will review publicly-available tools and datasets, discuss the state of GIS technology in the city, and consider how the City uses geospatial data to serve NYC residents.
Join this conversation with agency GIS leaders about new maps & tools, geospatial data, and initiatives for 2025.
Moderator
Lee Ilan, NYC Mayor’s Office of Environmental Remediation
Panelists
Josh Friedman, NYC Emergency Management
Matt Croswell, NYC Department of City Planning
Carmela Quintos, NYC Department of Finance
Angel Adhikari, NYC Department of Finance
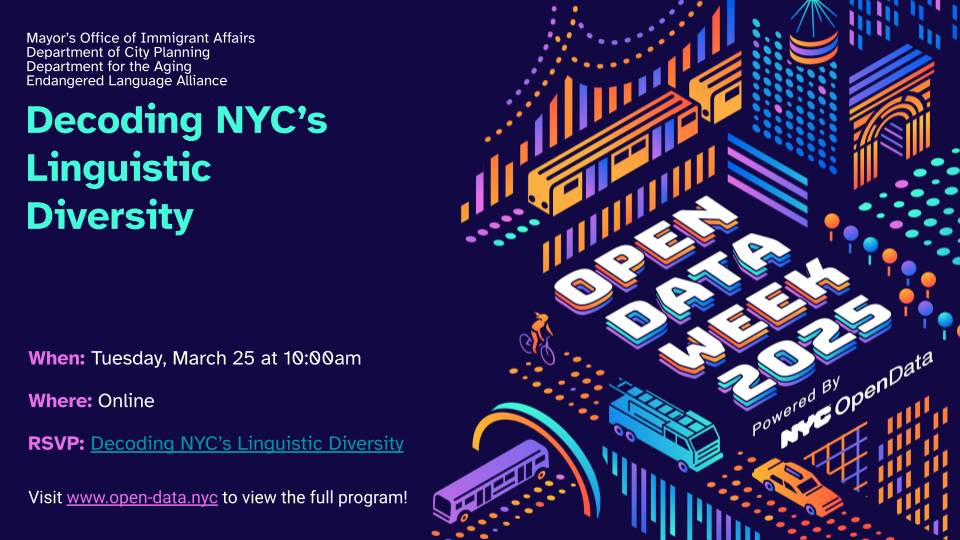
Explore how New York City—home to speakers of over 700 languages—can use data to improve language access for all residents. This collaborative workshop brings together experts from the Department of City Planning, the Department for the Aging, and the Endangered Language Alliance to demonstrate practical applications of language data analysis.
Learn how targeted data collection and analysis helps identify community-specific language needs, ensuring all New Yorkers can meaningfully access services and information. See real examples of how this data drives policy decisions and improves community engagement.
Join us here: https://us02web.zoom.us/j/83805539365?pwd=Lsc3Awq4o8MHCYjDfJqDiqeiwGBxbx.1
The Health Department provides interactive visualization tools, downloadable datasets, and rigorous research on New Yorkers’ health. Learn how to use these resources to support your own research, and to inform advocacy, programming, and policy.
Resources covered include:
* EpiQuery
* Environment and Health Data Portal
* Community Health Profiles
* NYC Open Data datasets from the Health Department
* Data pages on Covid-19 and Vital Statistics

Join our virtual event to discover a cutting-edge tool that pinpoints prime tree planting sites across NYC using NYC Open Data. This model empowers NYC Parks foresters to expand the City’s green canopy more efficiently. The model leverages datasets such as NYC Parks Tree & Site, NYC Planimetrics, DOT Traffic Signs, and the DOH Heat Vulnerability Index to drive site selection. Shawn Ganz, Data & Product Designer with NYC Parks, will break down the model’s purpose, methodology, and data foundations while advocating for greater open data access in urban planning. Wrap up the session with an engaging Q&A and discussion on future applications.