Open Data is rich, but can be overwhelming. Creating succinct, focused measures from Open Data allows New Yorkers quickly see how things are going and better understand complex issues.

The NYC Comptroller’s office recently released two new data dashboards that use Open Data resources to (1) track NYC Agency performance (https://comptroller.nyc.gov/services/for-the-public/measuring-nyc-government-performance/overview/) and (2) chart homelessness and eviction challenges facing New Yorkers (https://comptroller.nyc.gov/services/for-the-public/charting-homelessness-in-nyc/overview/).

This in-depth demonstration will:

  • Detail the information available on these two dashboards:
  • Measures of how key City agencies are delivering for New Yorkers
  • Details on the populations experiencing homelessness, facing eviction, and actions by the City to prevent eviction and move individuals out of shelter into permanent housing.
  • Show how we endeavored to tell full, meaningful stories of how City agencies are doing and the challenges New Yorkers face, relying only on public Open Data.
  • How to create relevant, informative measures from raw source data
  • How to combine and overlay data sources to add depth to a complex topic like housing and homelessness
  • Facing limitations of the data available
  • Give an overview of the technical tools to build dashboard views on Open Data sources
  • Querying Open Data data and metadata
  • Connecting data to PowerBI and custom tools

This session is a chance for researchers and Open Data users to get an in-depth understanding of the data available on these new dashboard products, learn how to design rich dashboards that contribute to understanding on complex policy issues, and get technical pointers for accessing Open Data.

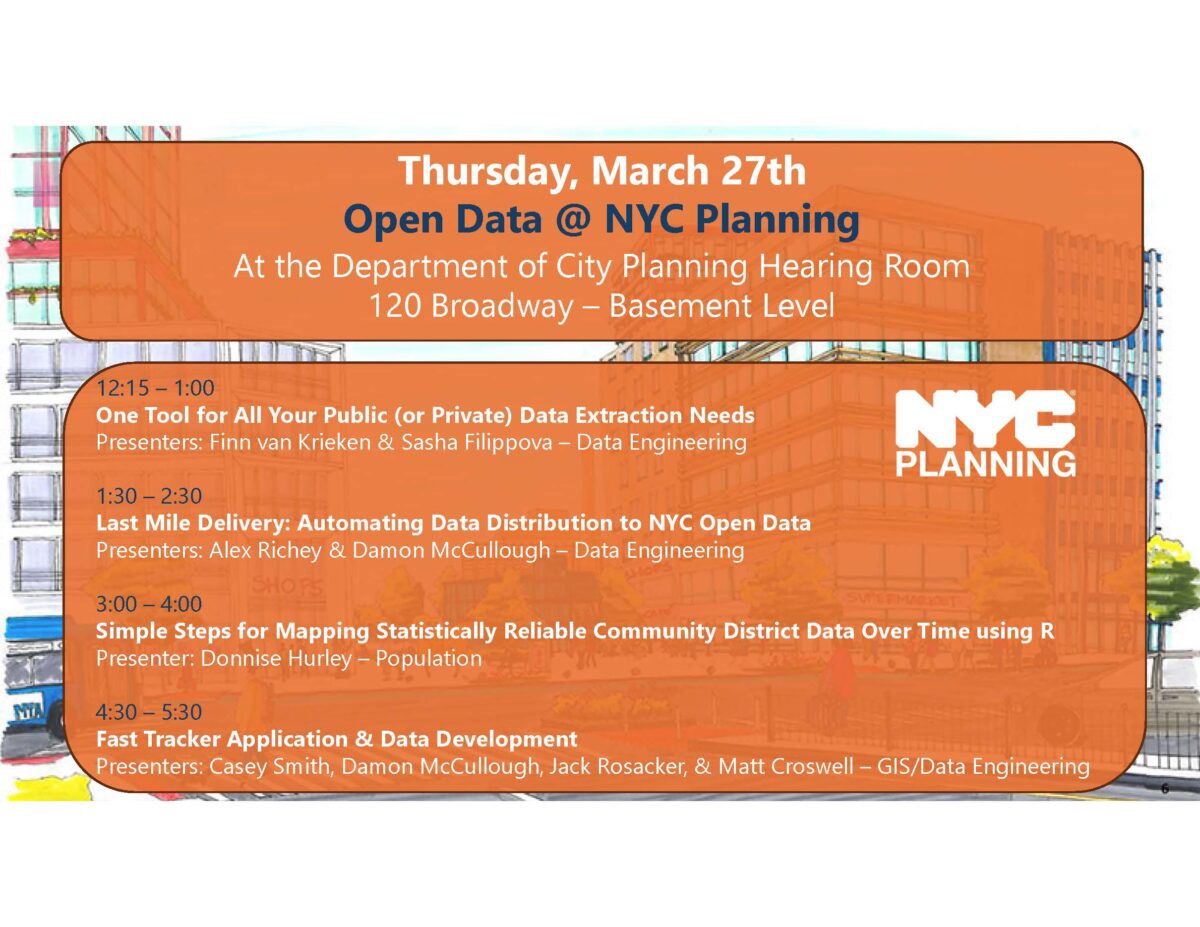
NYC Planning has developed the Fast Tracker app to allow users to determine whether planned housing projects are eligible for the new citywide Green Fast Track rule. The rule streamlines housing production by allowing projects of a specific typology to simplify the environmental review process, while satisfying state and city environmental standards. The app integrates ESRI Experience Builder with Survey123 and Microsoft Power Automate so users can enter project criteria and determine eligibility under the rule. We will discuss developing the app in tandem with the rule, under a strict timeline and scope. This presentation will focus on how the app was developed, how data was collected, reviewed, and processed for inclusion in the app. We will also talk about how the app and data pipelines are maintained.

This presentation is part of the Open Data @ NYC Planning event series.

Click here to RSVP for virtual attendance.

Click the blue “Going” button below to RSVP for in-person attendance at the Department of City Planning’s offices (120 Broadway, New York, NY 10271).

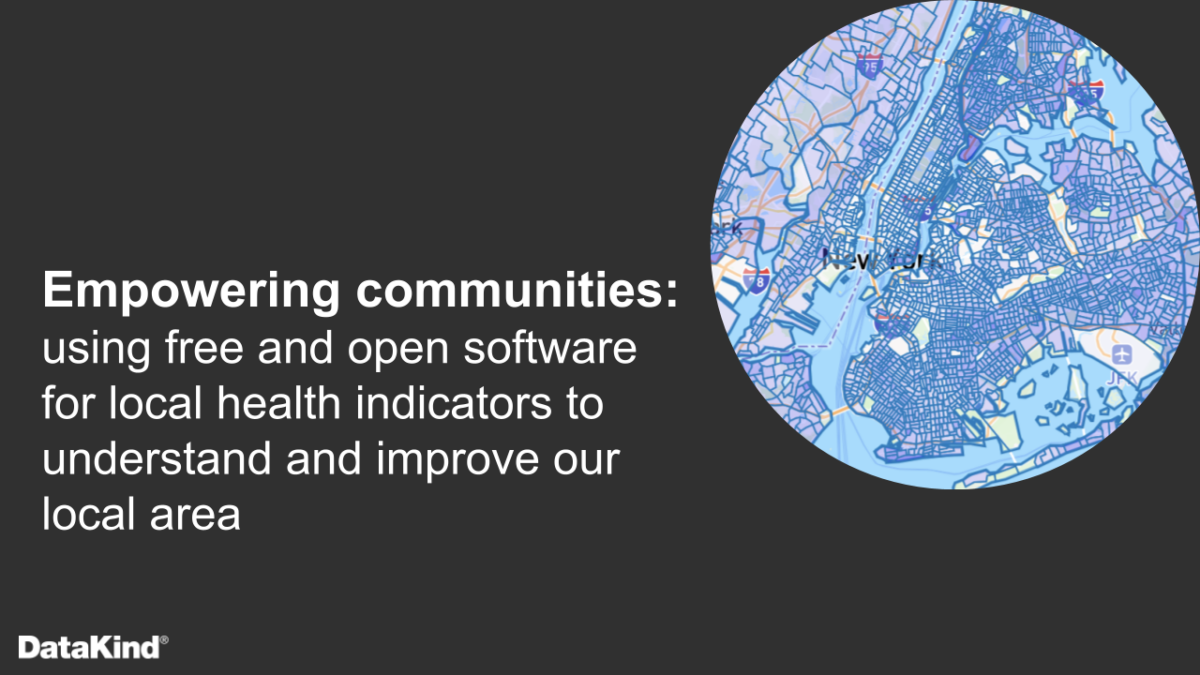
DataKind started 2024 with an ambitious goal: to create an open-access tool populated with data at a hyperlocal level that would foster a deeper understanding of community needs and the complex factors influencing them. Working with collaborators representing many facets of health and wellbeing, DataKind launched the community health indicators software, a tool which enables social service providers, practitioners, policymakers and community stakeholders to access standardized data on their communities of impact and take meaningful action. This resource harmonizes and makes accessible 11 different public data sources of community data at three geographic levels (tract, zip, and county), with 49 unique data indicators drawing from a database of six million rows of data. Users have the option to create a free, secure individual or team account and upload and analyze additional datasets alongside the data included. Users can export analysis, including maps, from the system. This free and open software makes data insights accessible to any end-user regardless of data maturity.

This session will discuss the community-centered software design process, demonstrate the software with several use cases, and offer a rich, facilitated conversation with end-users of the software from social impact and governmental institutions. We will provide an introduction to question formulation, asset mapping, and data interpretation.

Attendees can submit their data questions here for use in the session or for future follow-up: https://forms.gle/TsWfe4Dses3jzVHm8

COVID-19 changed people’s lifestyles all over the world. This event will focus on analyzing resident housing property sales data in New York City from 2019 to 2023, before, in, and after COVID periods. By examining trends in sale prices, property characteristics, and neighborhood differences, this analysis aims to uncover key insights into the residential real estate market. Furthermore, machine learning techniques will be applied to predict property values and classify neighborhoods based on various factors such as location and building type. An end-to-end data pipeline process will be demonstrated in this talk (data collection, wrangling, visualization, feature engineering, machine learning modeling) via the python notebook.

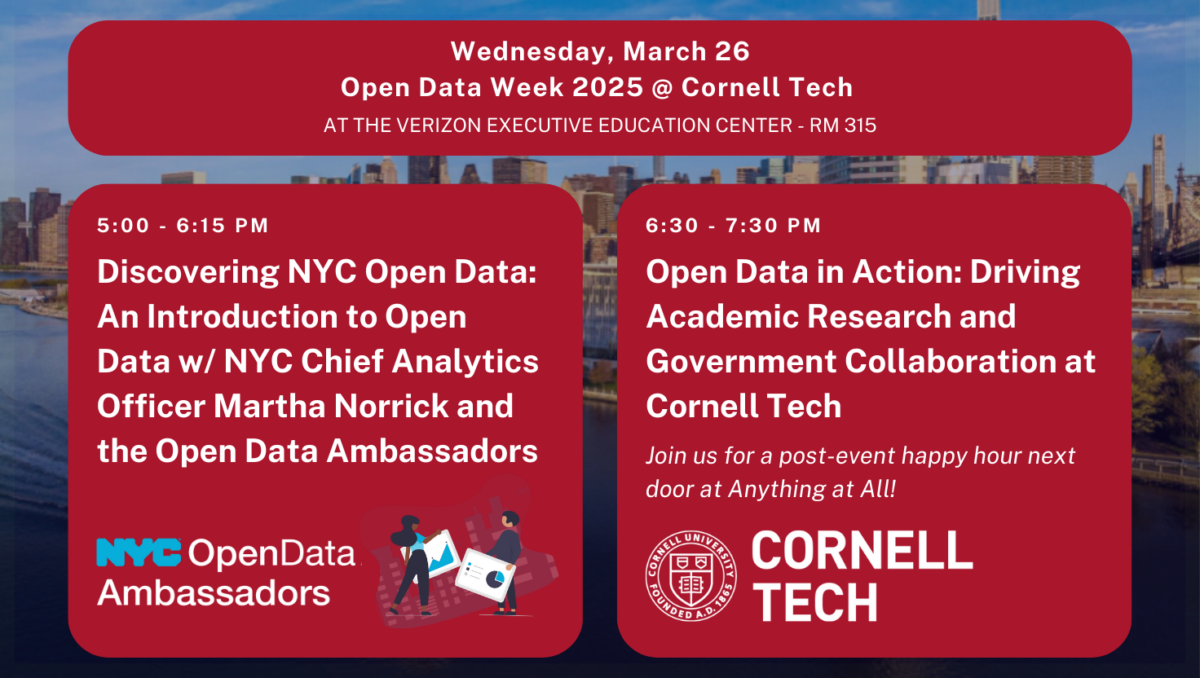
Join us for an exciting set of back-to-back presentations featuring Cornell Tech researchers and practitioners as they share their real-world applications of NYC Open Data. This session offers a unique opportunity to explore how open data is being leveraged to address urban challenges, improve decision-making, and drive innovation across a variety of fields. Participants will gain valuable insights from experts who are actively shaping the future of NYC through data-driven solutions.

This event is part of an Open Data Week series hosted by Cornell Tech— learn more below!

Presentations:
The ABCs of a PiTech Fellow: Artificial Intelligence (AI) & Natural Language Processing (NLP), Block Party & Community Boards
Breanna Green, PhD Candidate, Information Science, Cornell Tech

Data-driven analyses and optimization of 311 systems: Applications to NYC Parks
Zhi Liu, PhD Candidate, Operations Research and Information Engineering, Cornell Tech

Data analysis and modeling of public building construction in New York City
Sara Venkatraman, Senior Research Associate in Statistics, Weill Cornell Medical College

Democratizing Policy Counterfactuals with AI: A deep dive into Local Law 97, NYC’s groundbreaking law to cut carbon emissions in its largest buildings
Vianney Brandicourt, Urban Tech Fellow, Cornell Tech

Analyzing the effects of congestion pricing using Open Data
Nikhil Garg, Assistant Professor, Cornell Tech

Predictive Maintenance for NYC Subway Lines
Atmika Pai, MS Candidate, Information Systems, Jacobs Technion-Cornell
Bhoomika Mehta, MS Candidate, Information Systems, Jacobs Technion-Cornell

SenTree: Leveraging NYC Open Data to predict urban tree health
Rishabh Surendran, MBA Candidate, Johnson Cornell Tech
Shubham Arya, MBA Candidate, Johnson Cornell Tech

– – 
This event is part of an Open Data Week series hosted by Cornell Tech on Wednesday, March 26 from 5-8pm. We’d love for you to join us for both sessions— though it is not required! We’ll kick off at 5:00 pm with a hands-on Discovering NYC Open Data class from the Open Data Ambassadors, where you’ll learn the fundamentals of NYC Open Data. Following that, at 6:30 pm, Cornell Tech researchers and experts will discuss their real-world applications of open data, during Open Data in Action: Driving Academic Research and Government Collaboration at Cornell Tech. Join us for a post-event happy hour next door at Anything at All!

There are many easy ways to get to Cornell Tech, located on Roosevelt Island. For maps and directions see here.

NYC School of Data is a community conference that demystifies the policies and practices around open data, technology, and service design. This year’s conference helps conclude NYC Open Data Week and features 30+ sessions organized by NYC’s civic technology, data, and design community! Our conversations and workshops will feed your mind and inspire you to improve your neighborhood.

To attend, you need to purchase tickets. The venue is accessible, and the content is all-ages friendly! If you have accessibility questions or needs, please email us at schoolofdata@beta.nyc.

Thank you to Reinvent Albany and Esri for helping to cover conference costs and making it possible to meet in 2025.

And If you can’t join us in person, tune into the main stage live stream provided by the Internet Society New York Chapter. Follow the conversation #nycsodata on Bluesky.

Purchase your tickets here.

This presentation will showcase the technical aspects of the Property Tax Forecasting included in New York City Council’s Economic and Tax Forecasting Report. The event will include an introduction to the revenue unit team, fundamentals of the property tax system, and the data collection and the forecasting model used. This report gets published by the New York City Council as part of the budgetary oversight three times a year.
The presenters are Dilara Dimnaku, Chief Economist at the New York City Council and Andrew Wilber, Supervising Economist at New York City Council Finance Division, Revenue Unit.
This event will be beneficial to other data science and analytics teams that are using similar data sources by providing use cases along with domain knowledge in housing and tax related administrative data. Participants will be able to ask questions at the end of the presentation.

  • How confidently can we predict the impacts of zoning change on housing supply?
  • Can we use AI to create novel datasets that may allow us to better understand housing phenomena?
  • What would it take to model a reality in which we build 1 million housing units?

These were some of the questions that led Janita Chalam, an independent researcher with a background in software engineering and machine learning, to begin their research journey into discovering how open data, statistical modeling, and AI can help us tackle the housing affordability crisis.

This presentation will walk through what Janita has learned about the variables at play in NYC’s housing landscape and present a statistical analysis of the Bloomberg-era upzonings as a case study in examining the frictions to building more housing in NYC.

Finally, Janita will propose some ideas for what kind of data and methodologies we might need in order to make bolder claims about what it takes to get us out of the housing crisis. By the end of this talk, we will hopefully have a better understanding of the role that data and empiricism can and should play in our conversations about housing policy.

This talk is for anyone interested in housing affordability and will not require any expertise in the technologies mentioned.

Join nonprofits JustFix and University Neighborhood Housing Program (UNHP) for a virtual presentation on how they used open data and open-source community tools to build a dashboard that supports tenant organizing in buildings impacted by the collapse of Signature Bank.

Signature Bank financed some of the city’s worst slumlords for years, underwriting their unscrupulous business practices premised on neglect, displacement, and deregulation of rent-stabilized apartments. The bank collapsed in 2023 and the FDIC took over the mortgages for 2,000+ buildings with over 30,000 units of rent-stabilized housing. This changed the incentives to make it possible to hold landlords accountable and allow tenants to use their power in new ways to get meaningful repairs made and even take control of their buildings through collective ownership models.

Ana Peña (Community Research & Data Analyst at UNHP) and Maxwell Austensen (Software Engineer at JustFix) will share the background on Signature Bank and opportunities presented in the wake of its collapse, how they worked with various stakeholders to guide the project, how they used open data and open-source tools to create the data dashboard, and how tenants, organizers, and other groups are utilizing the dashboard to build power and improve housing conditions.

This presentation is open to all, requires no specialized knowledge or skills, and might be most relevant to:
– NYC tenants interested in the situation with Signature Bank and how data can support organizing
– Government agency workers interested in seeing how their open data can be used for good.
– Civic tech enthusiasts interested in ways to access and utilize open data in new ways.